Fig. B.1.
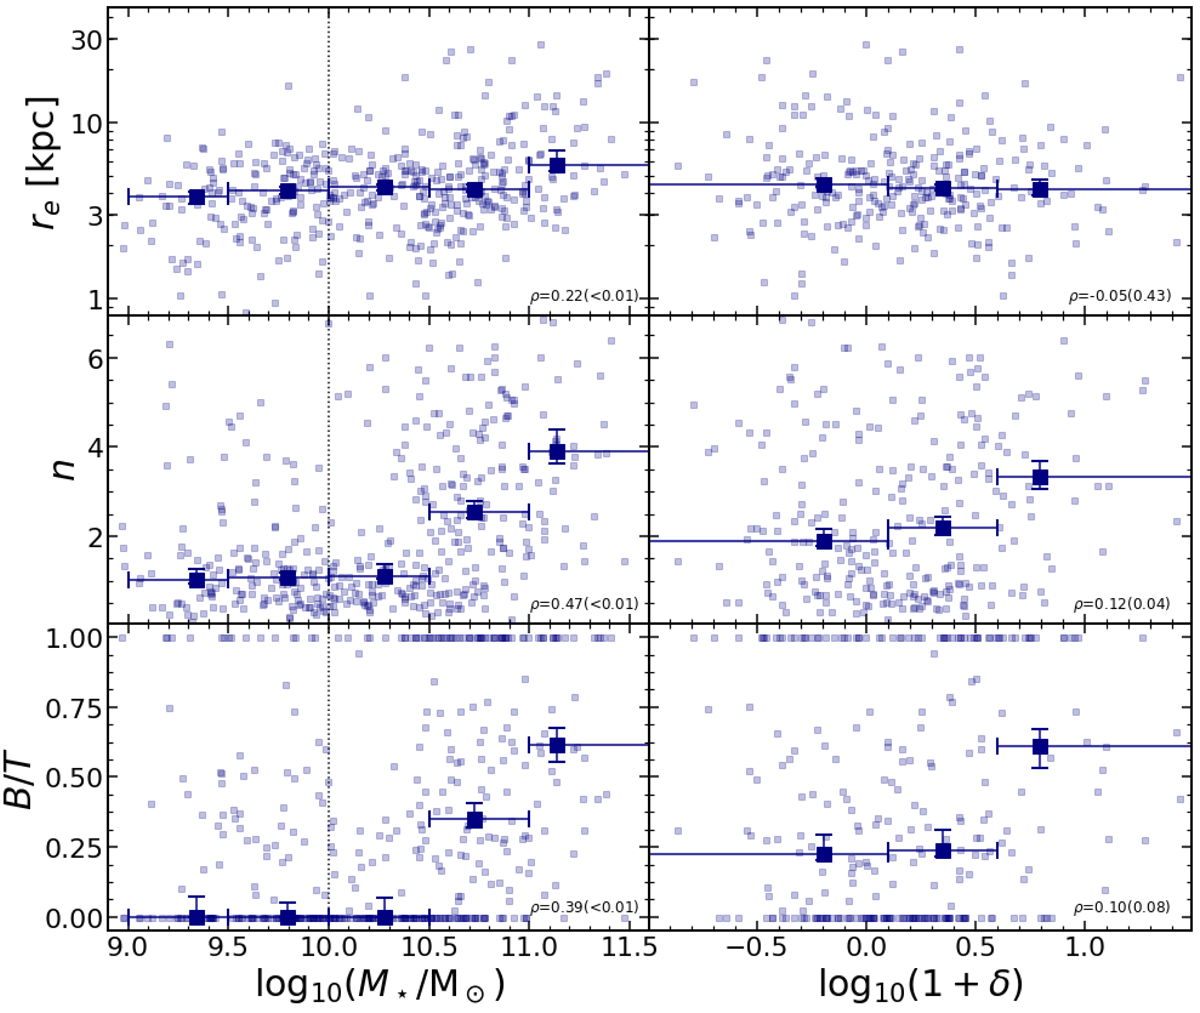
Dependence of z ∼ 0.84 galaxy sizes (top), Sérsic indices (middle), and the bulge-to-total ratio (bottom) on the stellar mass (left) and the environment (right) for the global sample. In each panel, we show the Spearman correlation coefficient, ρ, and the corresponding probability of an uncorrelated dataset having the same distribution in parentheses (the coefficient is computed for galaxies with M⋆ > 1010 M⊙).
Current usage metrics show cumulative count of Article Views (full-text article views including HTML views, PDF and ePub downloads, according to the available data) and Abstracts Views on Vision4Press platform.
Data correspond to usage on the plateform after 2015. The current usage metrics is available 48-96 hours after online publication and is updated daily on week days.
Initial download of the metrics may take a while.