Fig. 4
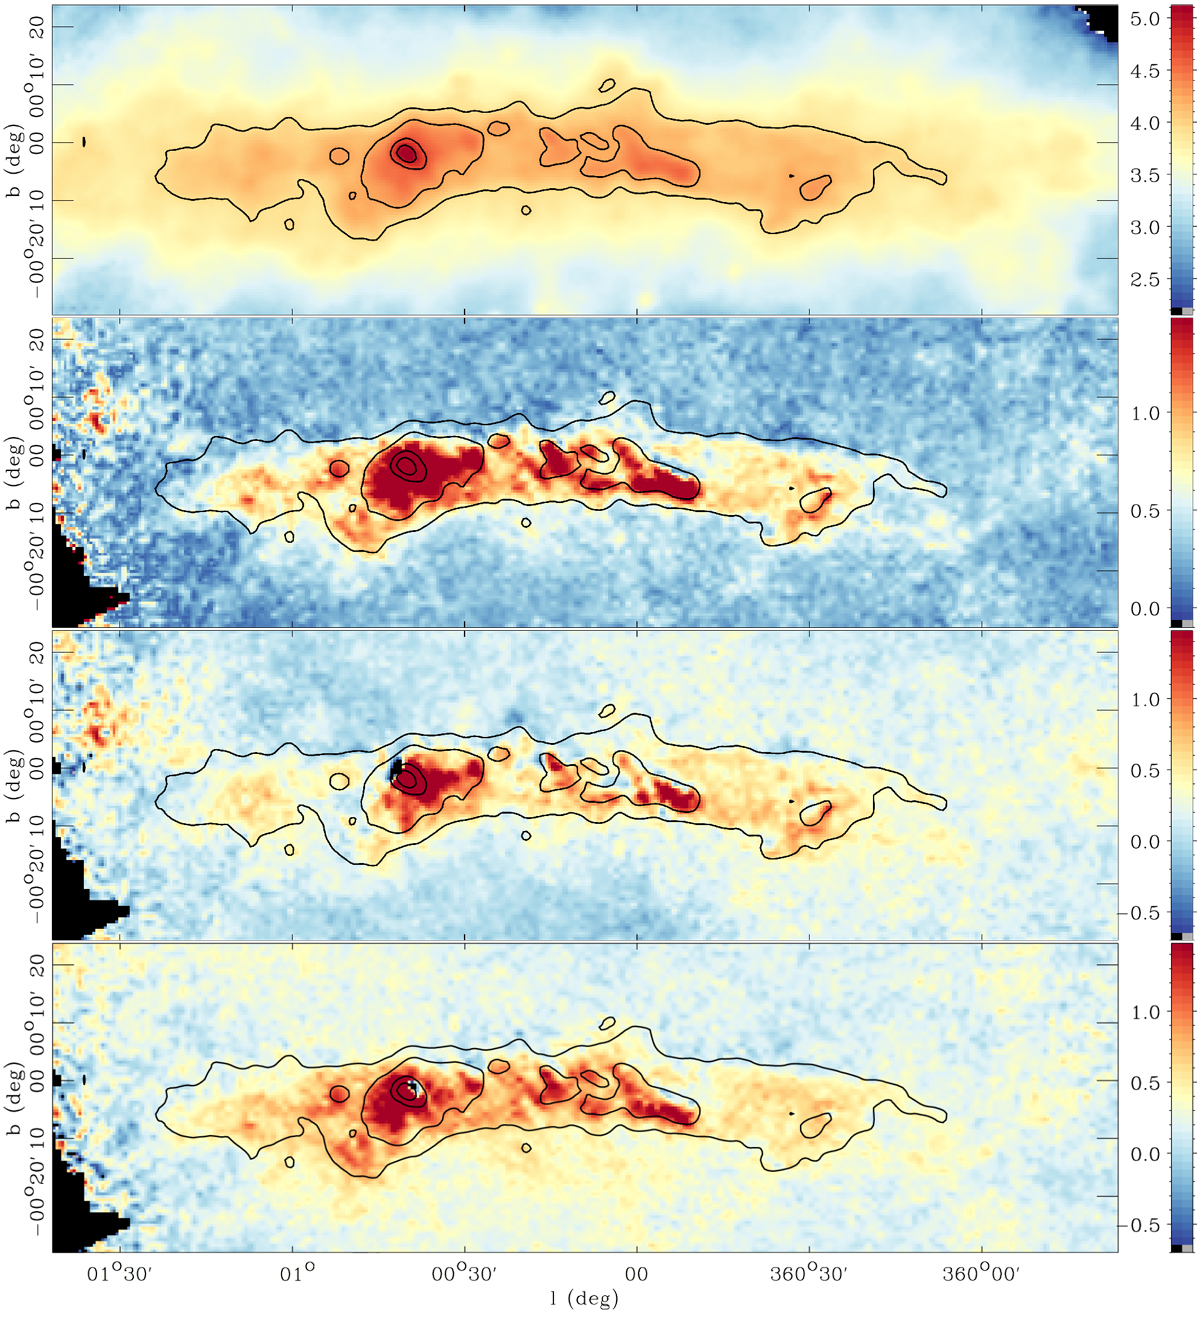
PILOT maps of, from top to bottom, the total intensity I, the polarized intensity P, the Stokes Q and U parameters, zoomed on the CMZ region and processed using the SCANAMORPHOS software. The maps are shown at the full resolution of the instrument of 2.2′. The intensity map is shown in log scale. The maps of P, Q and U are in units of 103 MJy sr−1.
Current usage metrics show cumulative count of Article Views (full-text article views including HTML views, PDF and ePub downloads, according to the available data) and Abstracts Views on Vision4Press platform.
Data correspond to usage on the plateform after 2015. The current usage metrics is available 48-96 hours after online publication and is updated daily on week days.
Initial download of the metrics may take a while.