Fig. 6
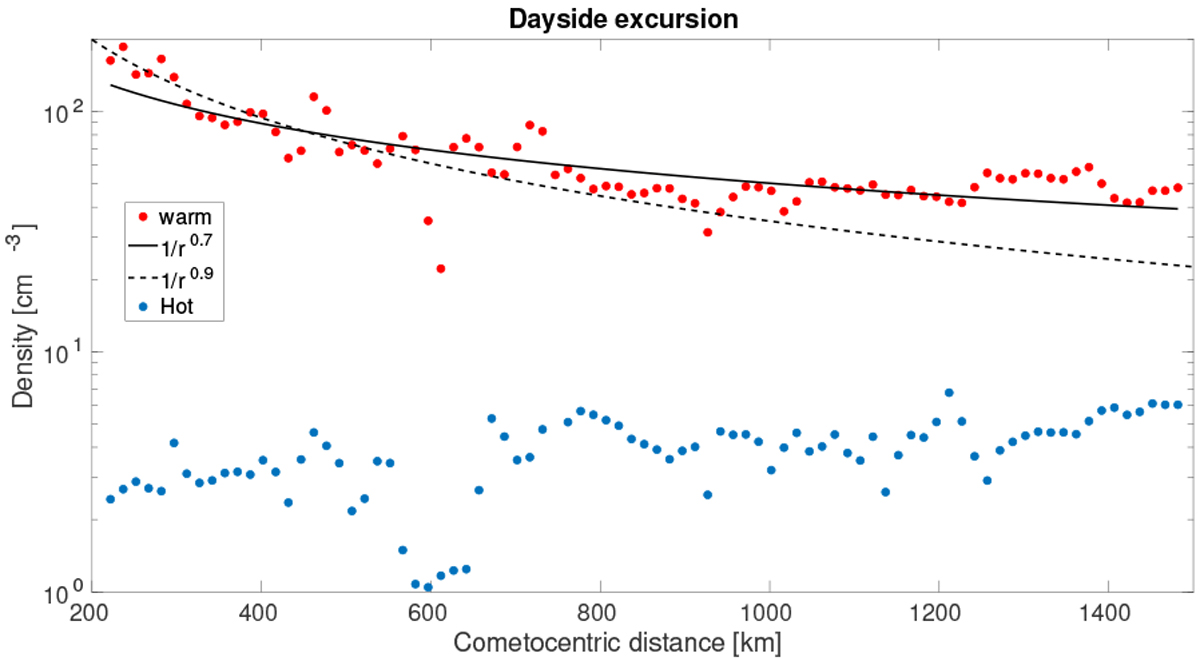
Warm and hot population densities as a function of cometocentric distance between 2015-08-01 and 2015-10-20. The red dots show the 30 km medians of the data. The black solid line shows the power law fit to the median values using the whole cometocentric distance range, while the black dashed line indicates a power law fit to points when rc < 450 km. 86% of the measured RPC-IES spectra were successfully fitted during the studied time interval.
Current usage metrics show cumulative count of Article Views (full-text article views including HTML views, PDF and ePub downloads, according to the available data) and Abstracts Views on Vision4Press platform.
Data correspond to usage on the plateform after 2015. The current usage metrics is available 48-96 hours after online publication and is updated daily on week days.
Initial download of the metrics may take a while.