Open Access
Fig. 3
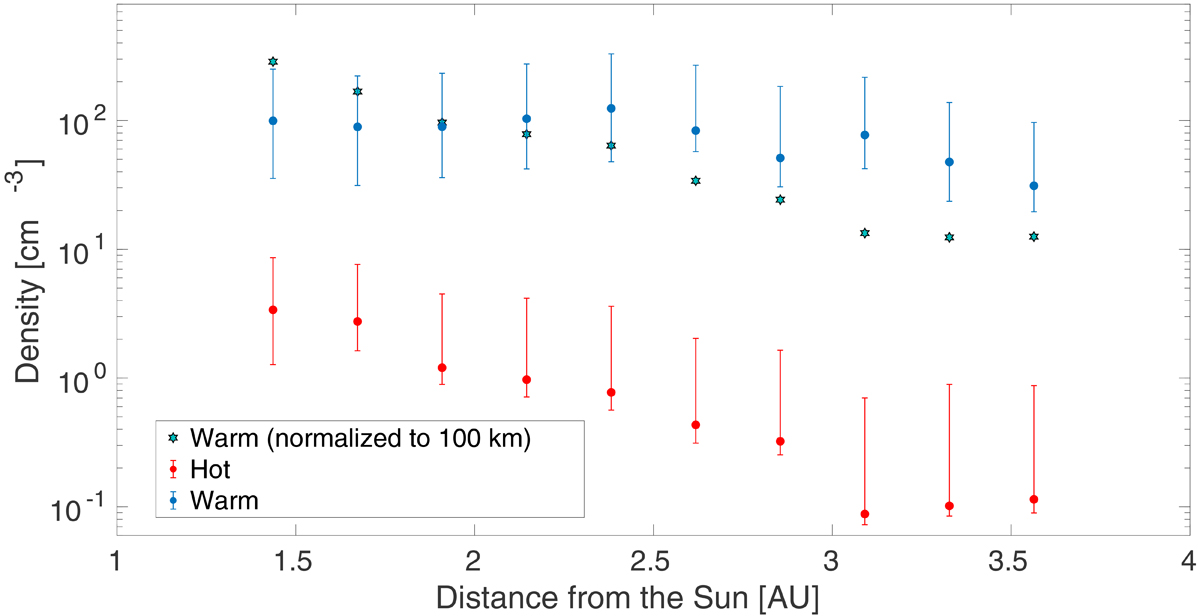
Hot (red dots) and warm (blue dots) electron population densities as a function of heliospheric distance. The blue stars shows the warm population density that has been normalized to 100 km (see Sect. 5.2). The error bars are showing the first and the third quartile to describe the spread of the data inside each bin
Current usage metrics show cumulative count of Article Views (full-text article views including HTML views, PDF and ePub downloads, according to the available data) and Abstracts Views on Vision4Press platform.
Data correspond to usage on the plateform after 2015. The current usage metrics is available 48-96 hours after online publication and is updated daily on week days.
Initial download of the metrics may take a while.