Fig. 1
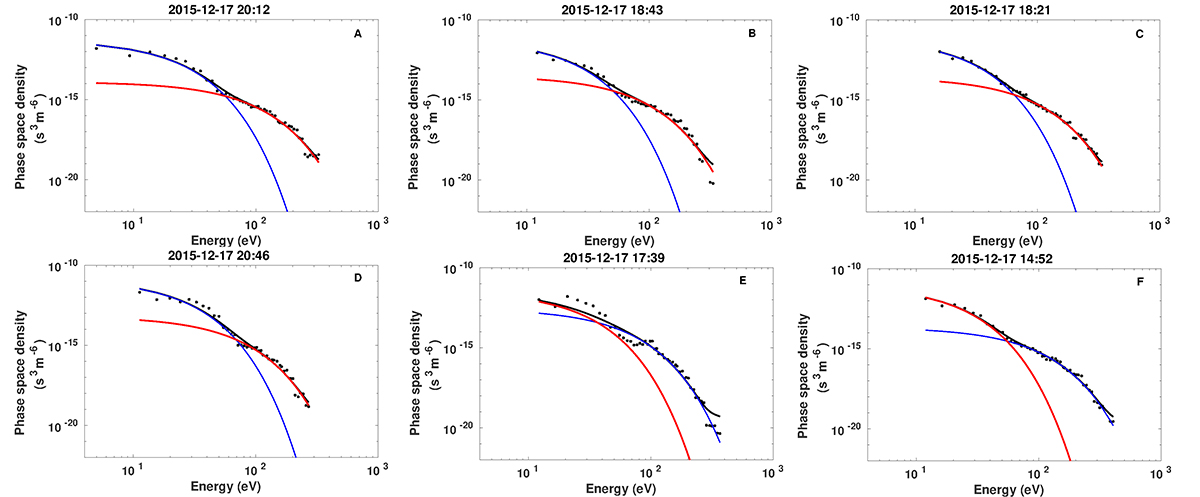
Examples of the fitted distributions. The observed phase-space density as a function of energy is plotted with black dots, the fitted distribution for the warm population is plotted with blue, and the hot population with red. The black curves are the sum of the warm and hot population distributions and the constant background term. Upper panels: examples of distributions when the fitted parameters were accepted. Lower panels: indicate when the fitted parameters were rejected from the study. The χ2 values for the upper panels from left to right are 68.4, 21.6, and 8.4.
Current usage metrics show cumulative count of Article Views (full-text article views including HTML views, PDF and ePub downloads, according to the available data) and Abstracts Views on Vision4Press platform.
Data correspond to usage on the plateform after 2015. The current usage metrics is available 48-96 hours after online publication and is updated daily on week days.
Initial download of the metrics may take a while.