Fig. 5
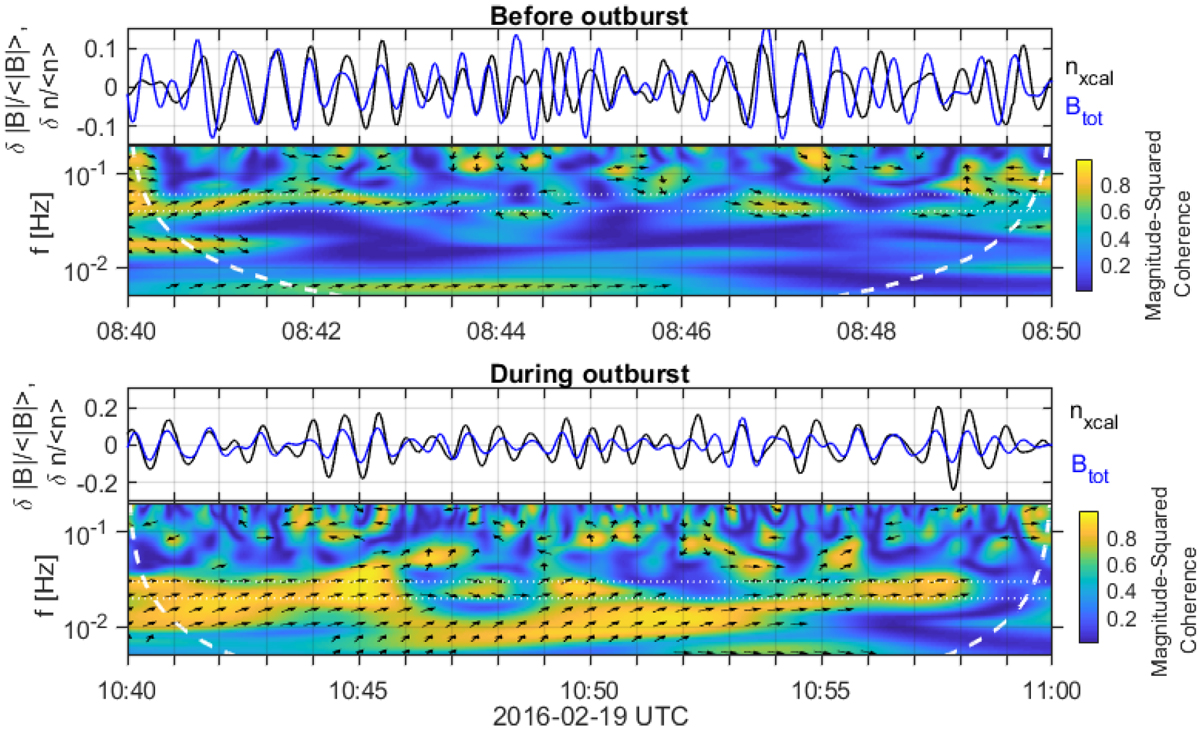
Correlation of the relative magnetic field amplitude and plasma density oscillations observed before (top) and during (bottom) the cometary outburst on 2016 February 19. The toppanels of each plot show the waveforms of the relative magnetic field amplitude (δ|B|∕⟨|B|⟩), blue line) and plasma density (δn∕⟨n⟩, black line) variations, bandpass-filtered in the [40–60] mHz (top) and [20–30] mHz (bottom) frequency range. The bottom panels show the magnitude-squared wavelet coherence of the magnetic field and cross-calibrated density signals in the time-frequency domain. The frequency range in which the signals, displayed in top panels, have been filtered is shown by the dotted white lines. The direction of the black arrows correspond to the instantaneous lag between the two signals on the unit circle.
Current usage metrics show cumulative count of Article Views (full-text article views including HTML views, PDF and ePub downloads, according to the available data) and Abstracts Views on Vision4Press platform.
Data correspond to usage on the plateform after 2015. The current usage metrics is available 48-96 hours after online publication and is updated daily on week days.
Initial download of the metrics may take a while.