Fig. 4
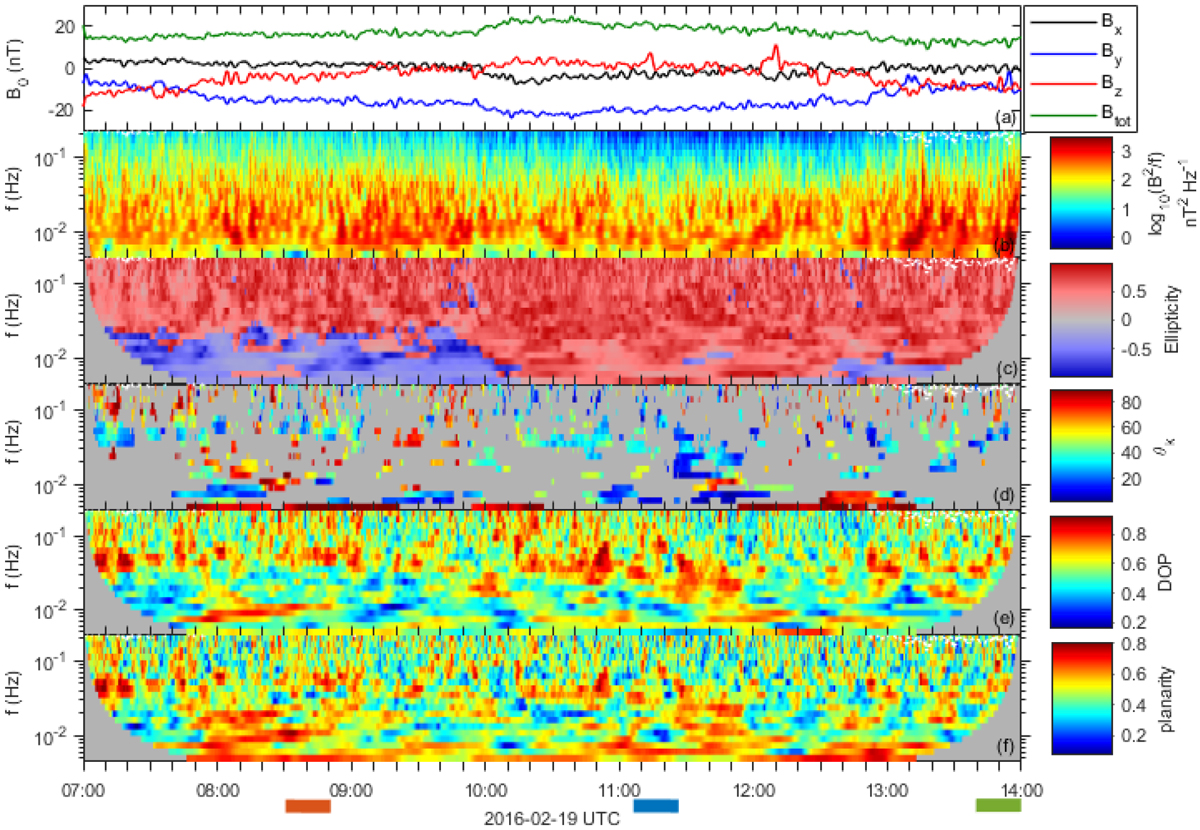
Polarization analysis of the magnetic field for the time interval 07:00-14:00 UT on 2016 February 19. From top to bottom, panel a: 3D waveforms of the background magnetic field and its modulus, low-pass filtered at 2 mHz. Panel b: spectrogram of the magnitude-squared total magnetic field. Panel c: polarization ellipticity of the magnetic field vector. Panel d: angle θk between thewave vector and the background magnetic field, in degrees. The wave vector is only drawn for a sufficient degree of polarization (DOP > 0.6) and planarity (>0.6). Panel e: degree of polarization of the magnetic field vector. Panel f: planarity of the wave vector. The 20-min time intervals used to compute Fig. 3 are shown as horizontal solid lines below the time tags, using the same color code.
Current usage metrics show cumulative count of Article Views (full-text article views including HTML views, PDF and ePub downloads, according to the available data) and Abstracts Views on Vision4Press platform.
Data correspond to usage on the plateform after 2015. The current usage metrics is available 48-96 hours after online publication and is updated daily on week days.
Initial download of the metrics may take a while.