Fig. 1
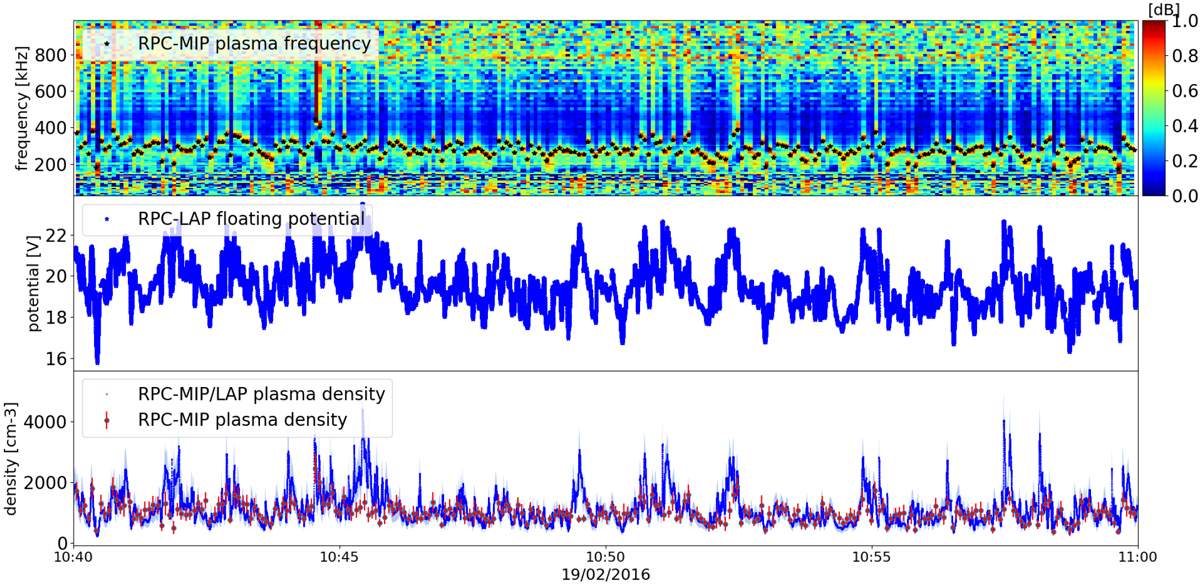
Top panel: power amplitude of the mutual impedance spectrogram, normalized to that obtained in vacuum, expressed in dB (right color bar) in the [0–600] kHz frequency range. The black dots indicate the identified plasma frequency for each spectrum. Middle panel: electric potential measured by the Langmuir probe RPC-LAP1, operated in floating mode, with respect to spacecraft potential. Bottom panel: plasma densities extracted from the RPC-MIP mutual impedance spectra (black dots) together with the estimated maximum measurement errors (shaded gray region) and RPC-MIP/LAP plasma densities obtained from the cross-calibration of the RPC-LAP floating potential measurement with the RPC-MIP absolute density measurements (blue line).
Current usage metrics show cumulative count of Article Views (full-text article views including HTML views, PDF and ePub downloads, according to the available data) and Abstracts Views on Vision4Press platform.
Data correspond to usage on the plateform after 2015. The current usage metrics is available 48-96 hours after online publication and is updated daily on week days.
Initial download of the metrics may take a while.