Fig. 9
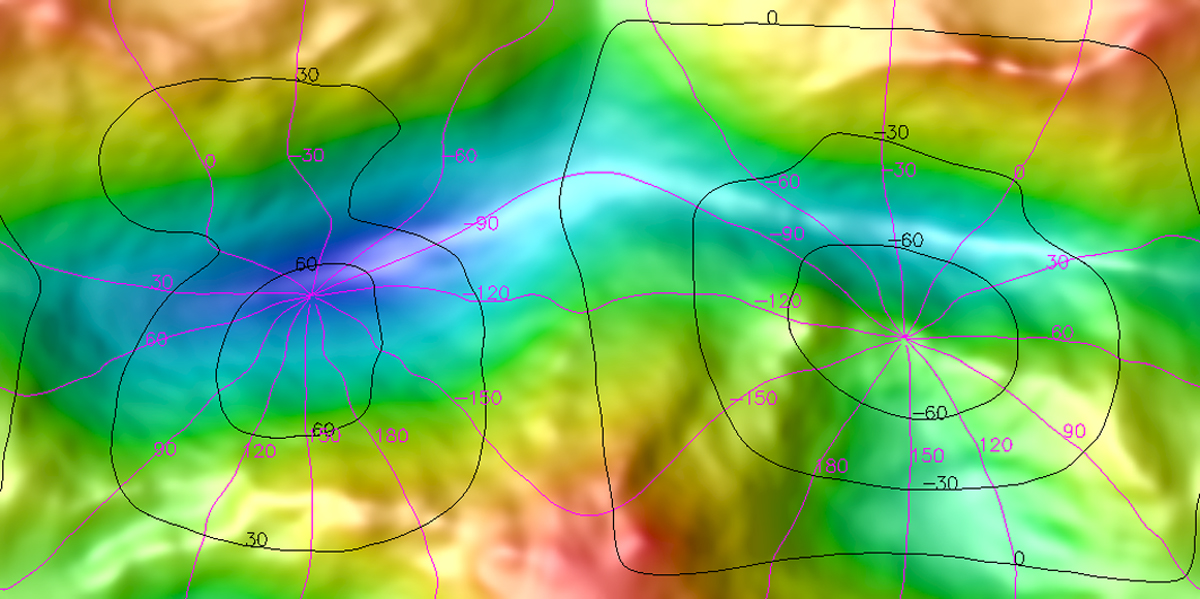
Unfolded QuACK map of the color-encoded distance from the comet center. The 401 × 201 data points are the same as in Fig. 8. The two squares that were sewn together (cf. Fig. 4) are displayed side by side. The left square approximately represents the northern hemisphere, and the right square shows the southern hemisphere. Latitudes are depicted in black and longitudes in magenta. The low (bluish) area is the neck, above is the head, and below the body of the duck-like shape of 67P.
Current usage metrics show cumulative count of Article Views (full-text article views including HTML views, PDF and ePub downloads, according to the available data) and Abstracts Views on Vision4Press platform.
Data correspond to usage on the plateform after 2015. The current usage metrics is available 48-96 hours after online publication and is updated daily on week days.
Initial download of the metrics may take a while.