Free Access
Fig. 4
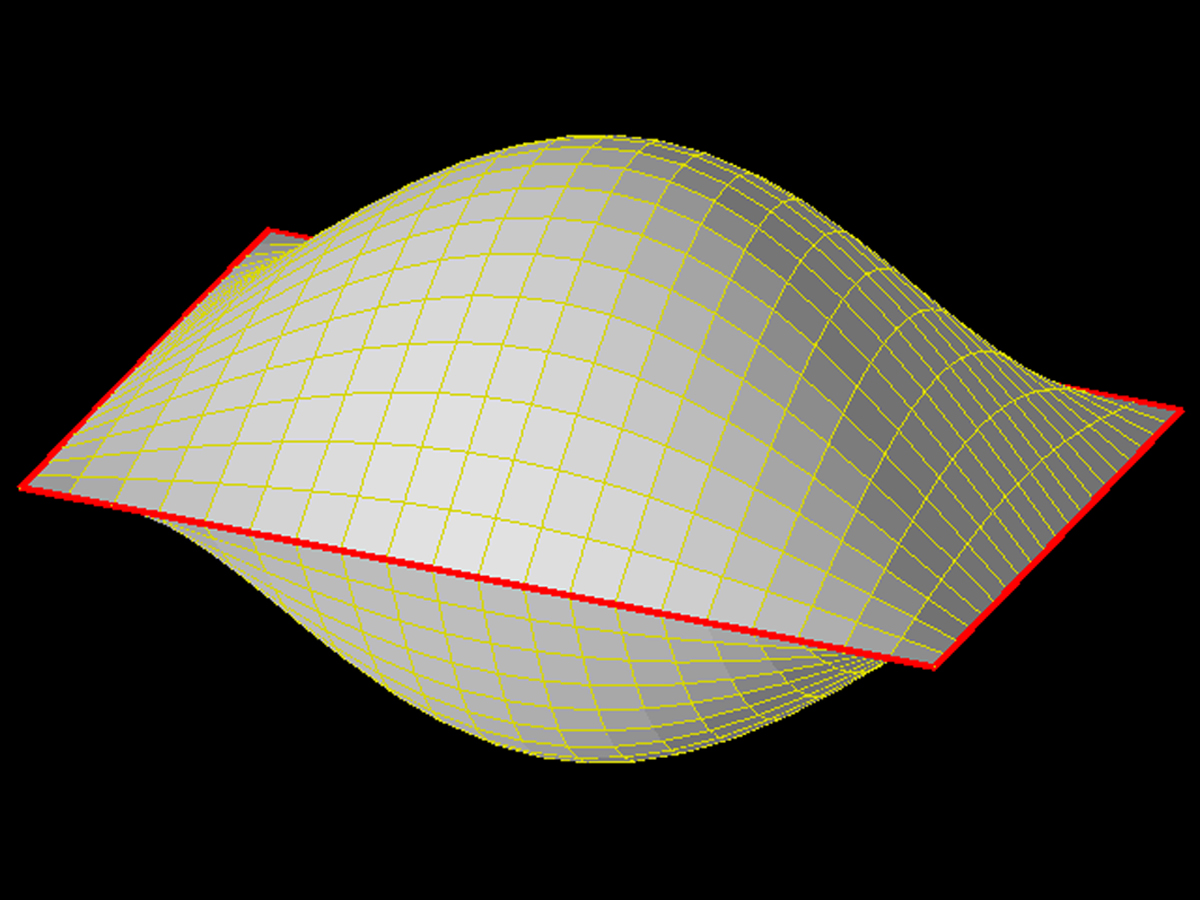
Illustration of the creation of the closed map by sewing together two square grids at all four (red) edges. The shown 3D shape has no actual meaning, it only serves to illustrate the topology of the closed map.
Current usage metrics show cumulative count of Article Views (full-text article views including HTML views, PDF and ePub downloads, according to the available data) and Abstracts Views on Vision4Press platform.
Data correspond to usage on the plateform after 2015. The current usage metrics is available 48-96 hours after online publication and is updated daily on week days.
Initial download of the metrics may take a while.