Free Access
Fig. 13
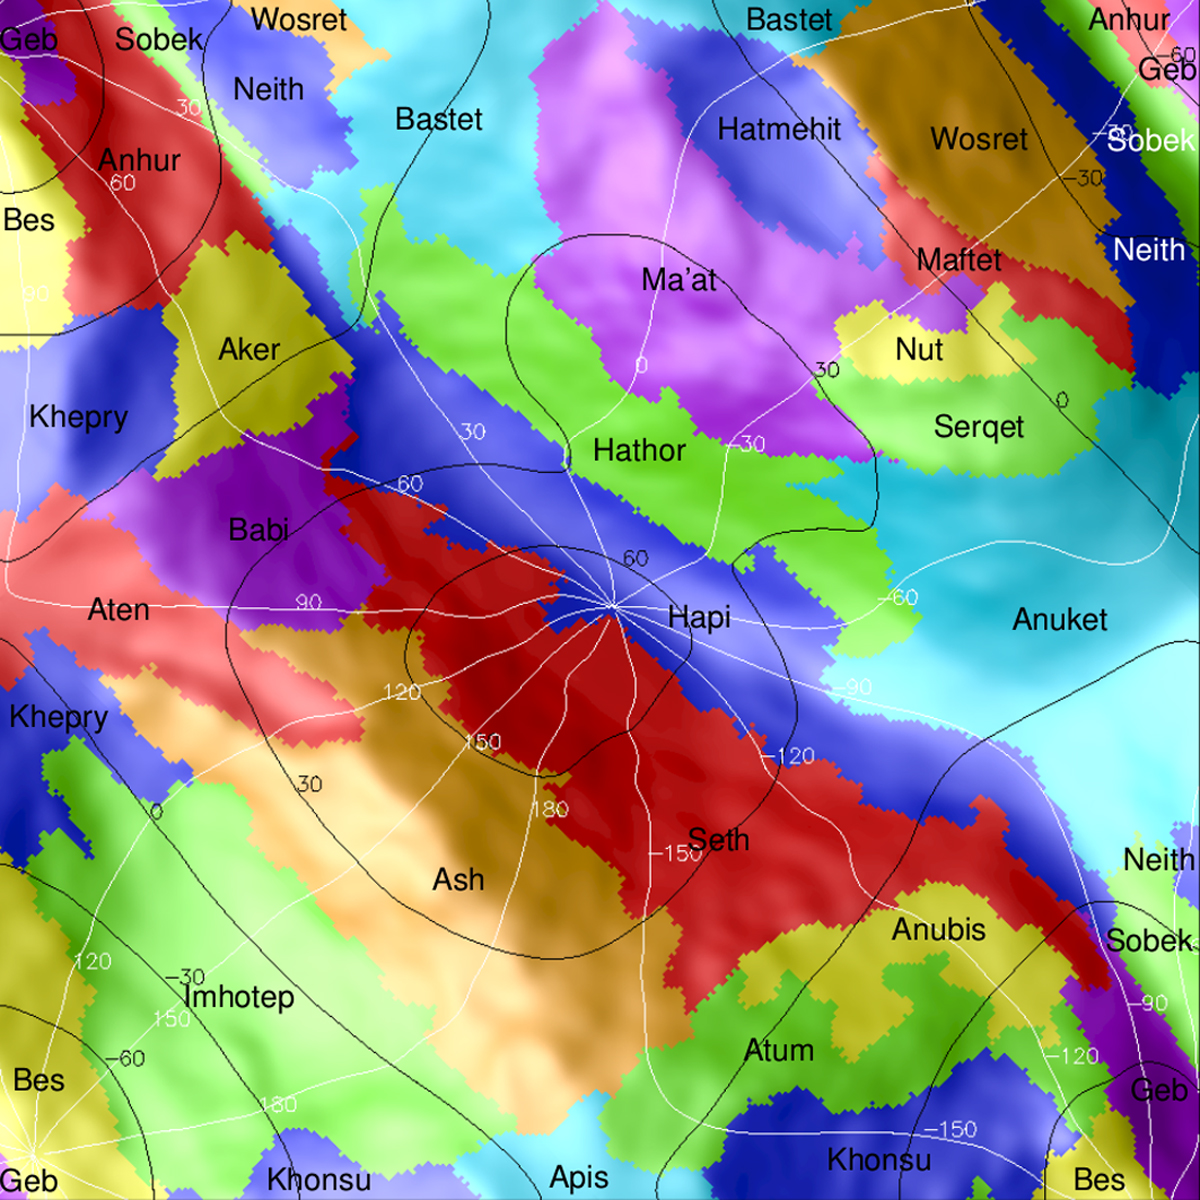
Another application of the QuACK map in quincuncial layout, showing the different regions of 67P. Latitudes are depictedblack and longitudes in white.
Current usage metrics show cumulative count of Article Views (full-text article views including HTML views, PDF and ePub downloads, according to the available data) and Abstracts Views on Vision4Press platform.
Data correspond to usage on the plateform after 2015. The current usage metrics is available 48-96 hours after online publication and is updated daily on week days.
Initial download of the metrics may take a while.