Open Access
Fig. 5
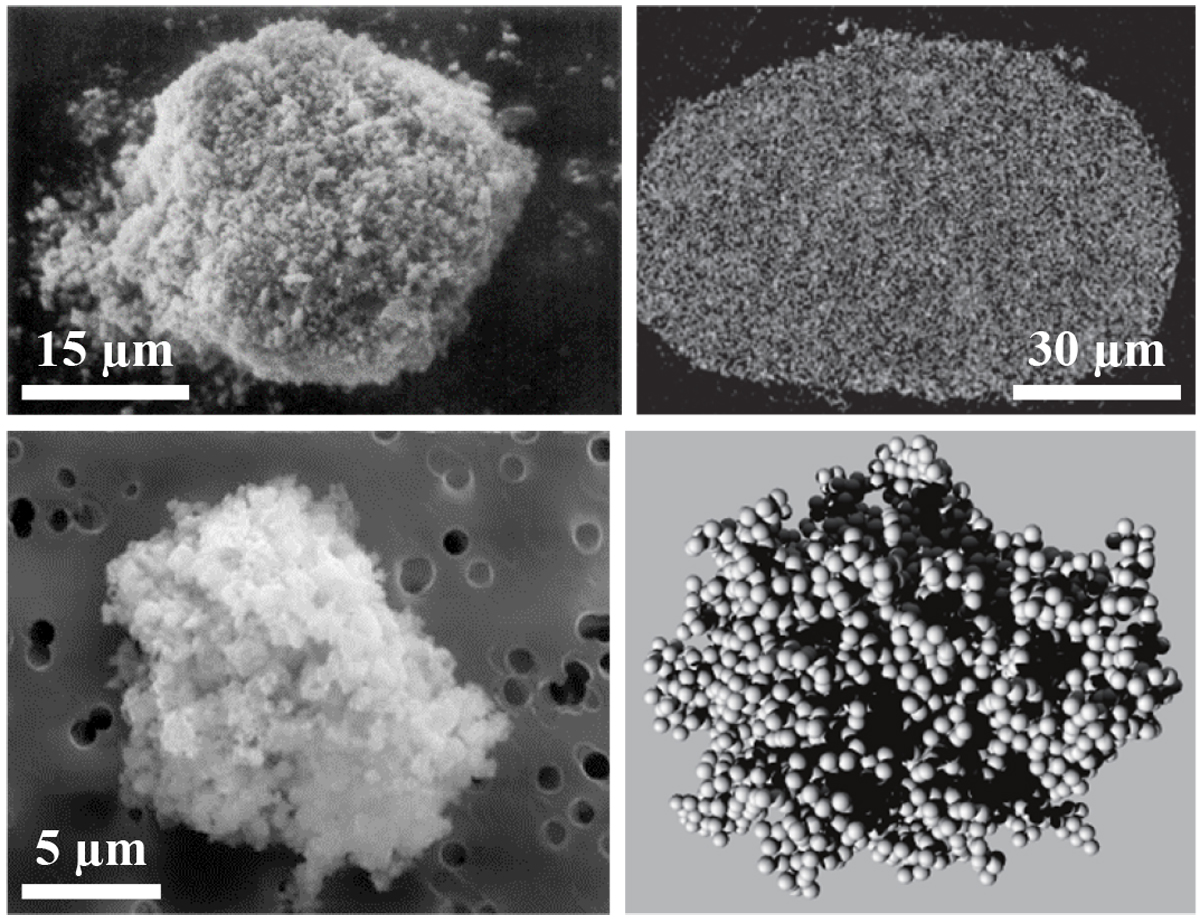
Agglomerates from the POROUS_1 type in Fig. 1. SEM image of a laboratory analog agglomerate (top left), an IDP (bottom left), a tomographic cross section (top right), and a computer model (bottom right; references in the text).
Current usage metrics show cumulative count of Article Views (full-text article views including HTML views, PDF and ePub downloads, according to the available data) and Abstracts Views on Vision4Press platform.
Data correspond to usage on the plateform after 2015. The current usage metrics is available 48-96 hours after online publication and is updated daily on week days.
Initial download of the metrics may take a while.