Open Access
Fig. 4
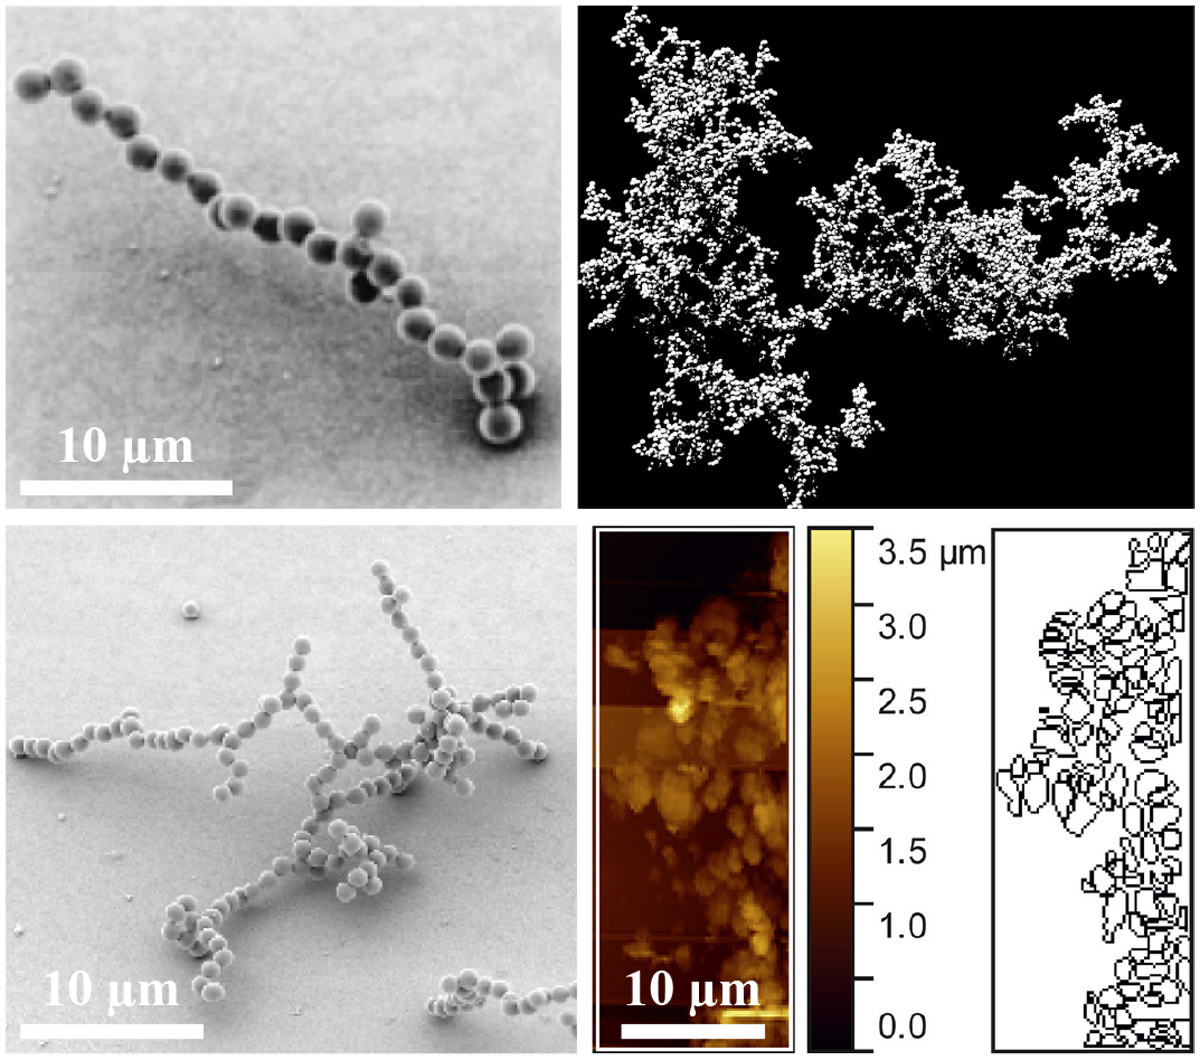
Fractal particles from laboratory experiments (left), computer simulation (top right), and Rosetta/MIDAS (bottom right, left and right of the scale bar; references in the text). The color code and scale bar for the bottom right image denotes height.
Current usage metrics show cumulative count of Article Views (full-text article views including HTML views, PDF and ePub downloads, according to the available data) and Abstracts Views on Vision4Press platform.
Data correspond to usage on the plateform after 2015. The current usage metrics is available 48-96 hours after online publication and is updated daily on week days.
Initial download of the metrics may take a while.