Fig. 14
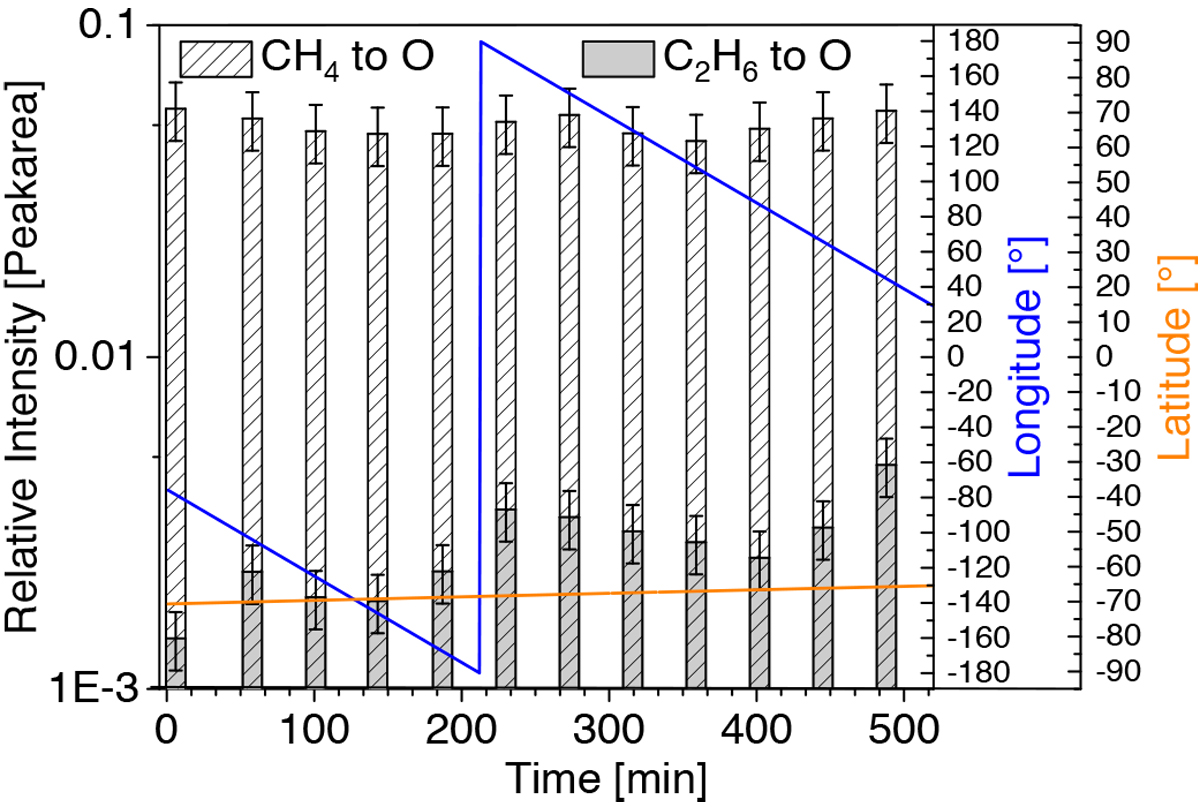
Evolution of hydrocarbon peaks over a cometary rotation. The plot shows the evolution for methane and ethane relative to the oxygen peak over the rotation duration of the comet (error bars are 1σ). The height of the bar represents the relative peak size. We also plot the latitude (orange) and longitude (blue) below the spacecraft. Spectra were taken every 45 min with a time difference of 8 min between mass 16 u/e, oxygen, and methane, and mass 30u/e, ethane.
Current usage metrics show cumulative count of Article Views (full-text article views including HTML views, PDF and ePub downloads, according to the available data) and Abstracts Views on Vision4Press platform.
Data correspond to usage on the plateform after 2015. The current usage metrics is available 48-96 hours after online publication and is updated daily on week days.
Initial download of the metrics may take a while.