Fig. 8
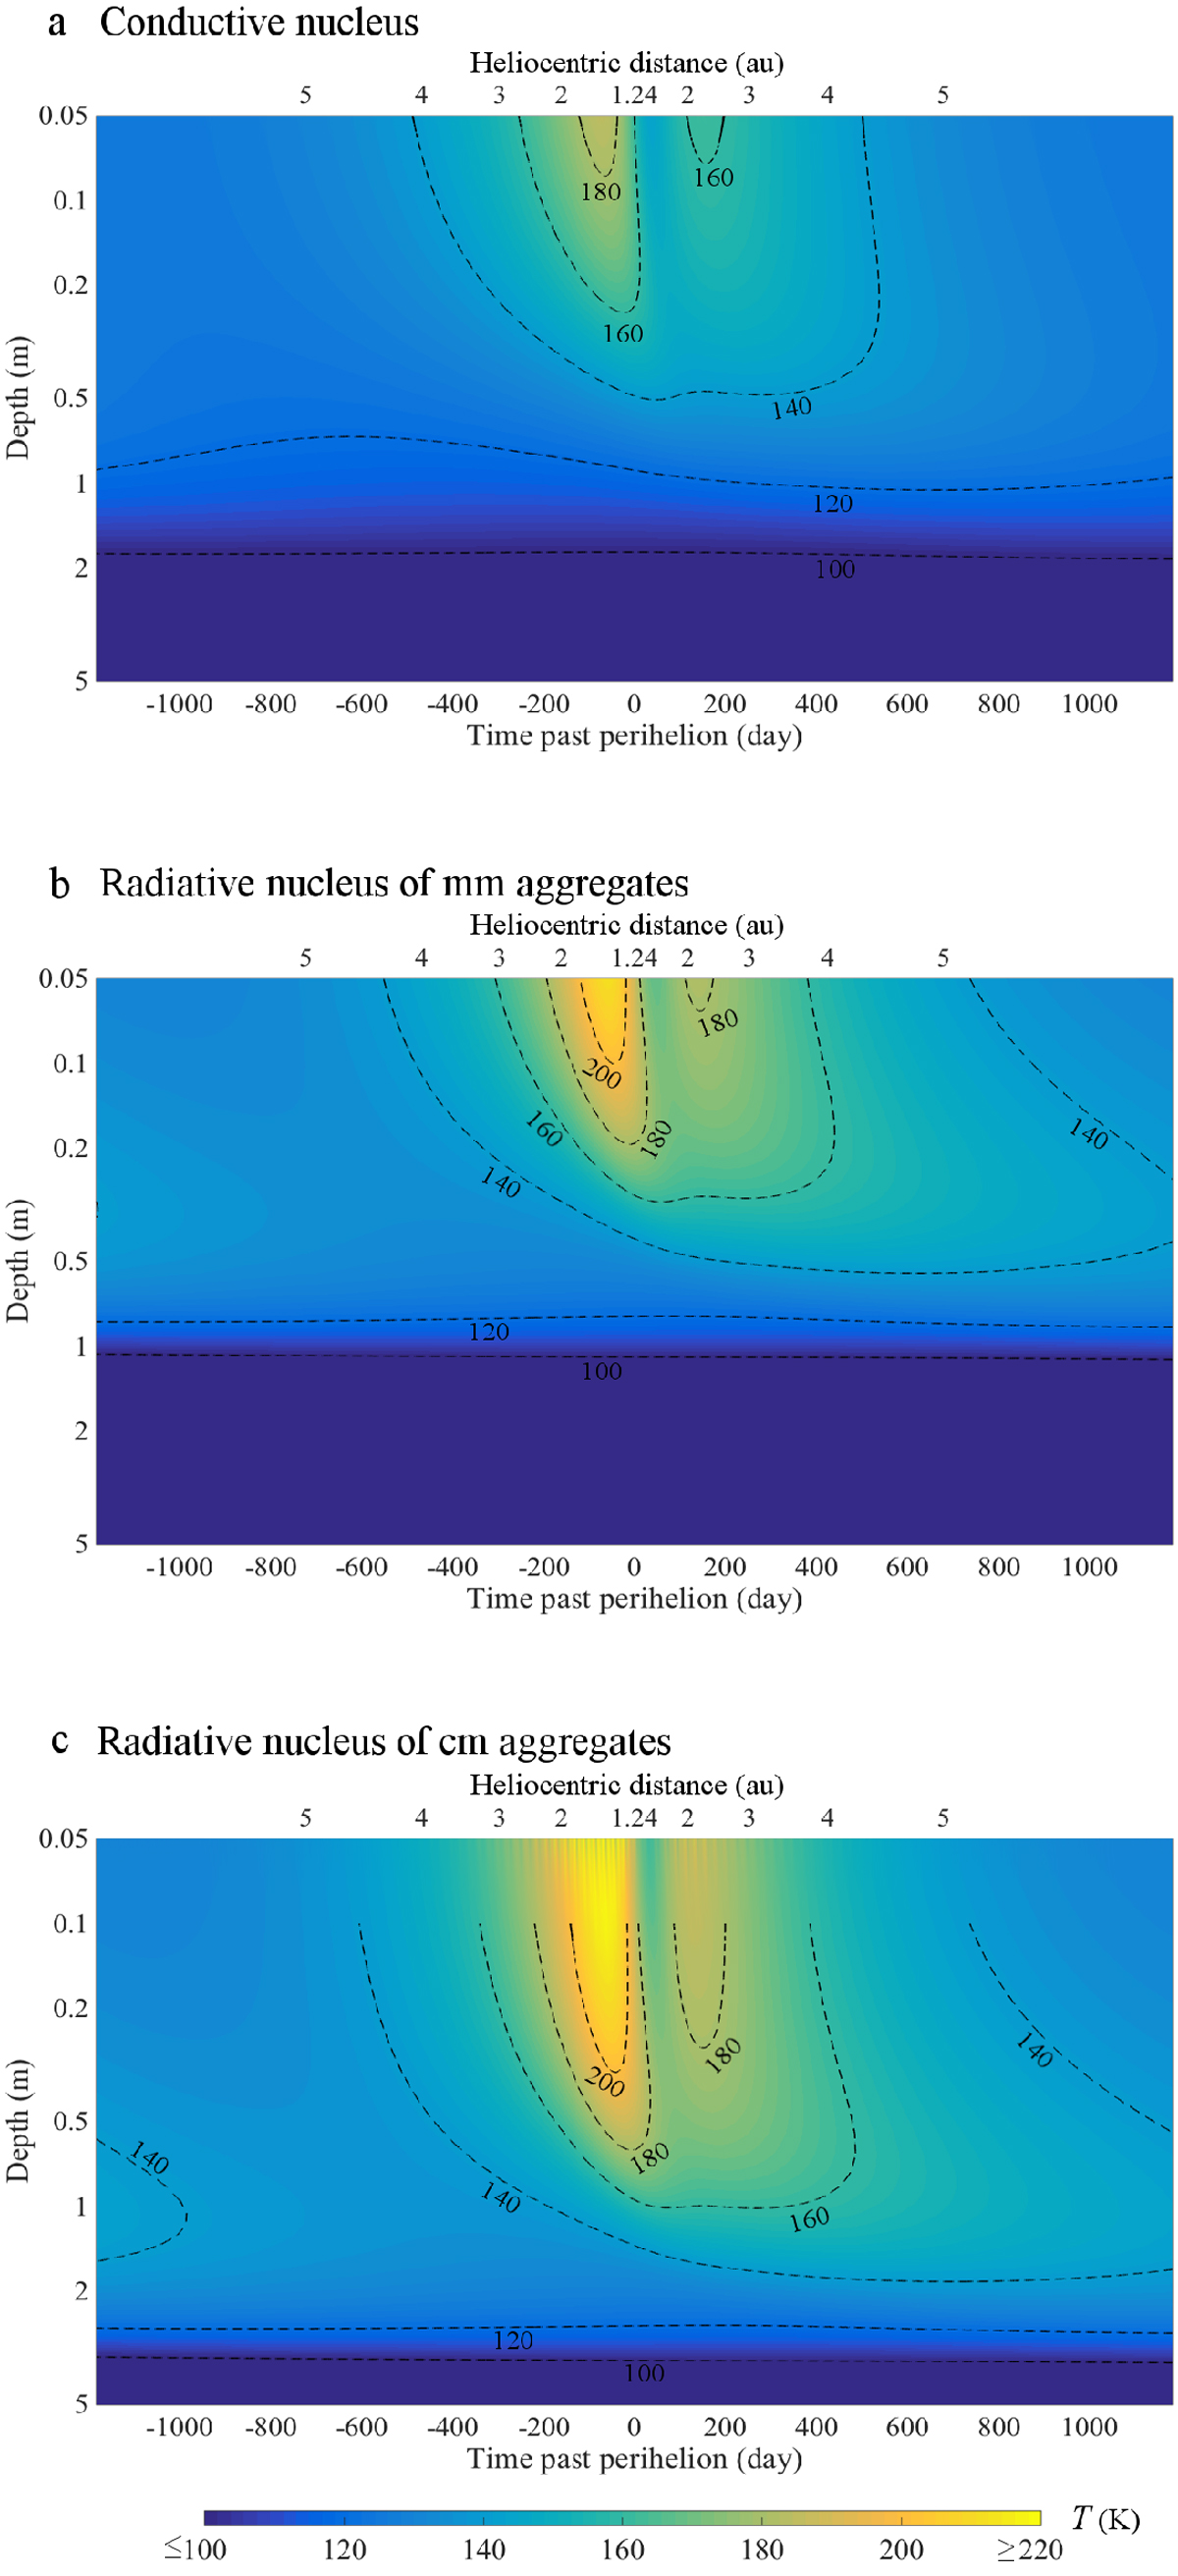
Evolution of subsurface temperature over one orbit of 67P. The temperatures are for the same location on the nucleus as inFigs. 5 and 7. The simulation parameters for the orbit and orientation of 67P are listed in Table 1. The nucleus is assumed to be dry. Results are shown for a conductive nucleus with κ = 0.002 W m−1K−1 (panel a), aradiative nucleus consisting of 1 mm aggregates (panel b), and 1 cm aggregates (panel c). In panel c, the contours are only indicated below 0.1 m because the temperatures in the upper layers display diurnal variations that clutter the contour lines.
Current usage metrics show cumulative count of Article Views (full-text article views including HTML views, PDF and ePub downloads, according to the available data) and Abstracts Views on Vision4Press platform.
Data correspond to usage on the plateform after 2015. The current usage metrics is available 48-96 hours after online publication and is updated daily on week days.
Initial download of the metrics may take a while.