Fig. 11
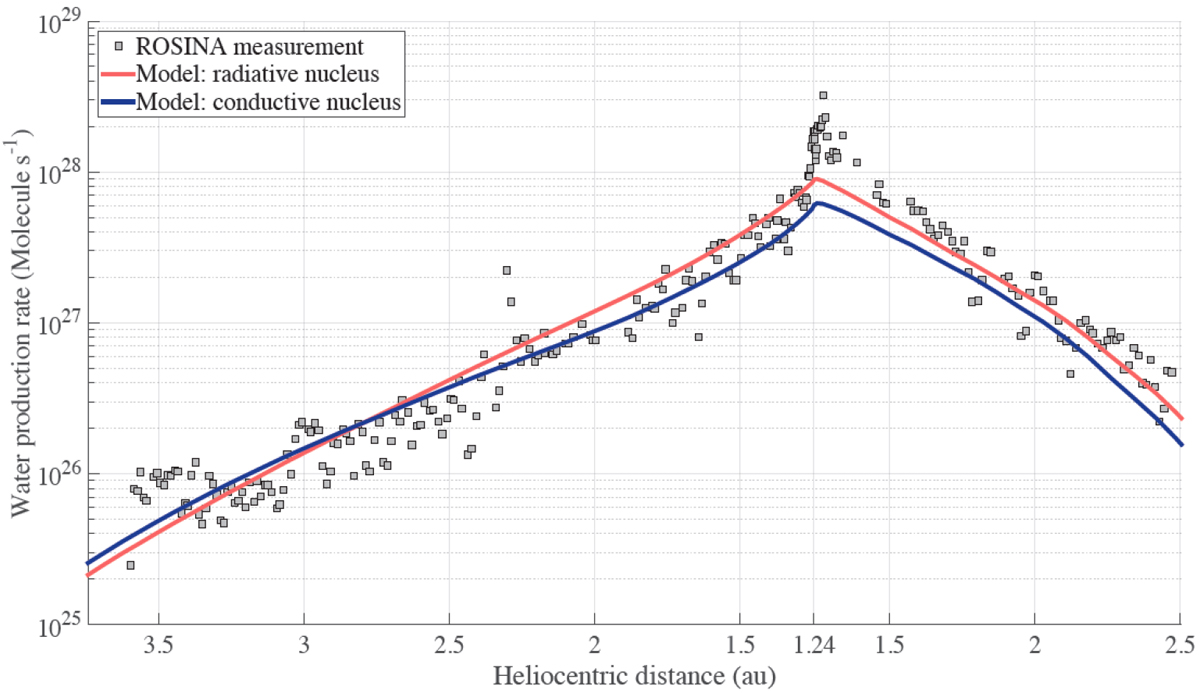
Modeled water production rate of 67P as a function of heliocentric distance. The red and blue solid lines correspond to the production rates from the radiative and conductive nuclei, respectively. In both cases, the aggregate size was assumed to be 1 mm. The constant heat conductivity was 0.002 Wm−1K−1. The water production rates derived by Fougere et al. (2016b) using ROSINA coma density measurements are plotted as gray squares for comparison.
Current usage metrics show cumulative count of Article Views (full-text article views including HTML views, PDF and ePub downloads, according to the available data) and Abstracts Views on Vision4Press platform.
Data correspond to usage on the plateform after 2015. The current usage metrics is available 48-96 hours after online publication and is updated daily on week days.
Initial download of the metrics may take a while.