Open Access
Fig. 4.
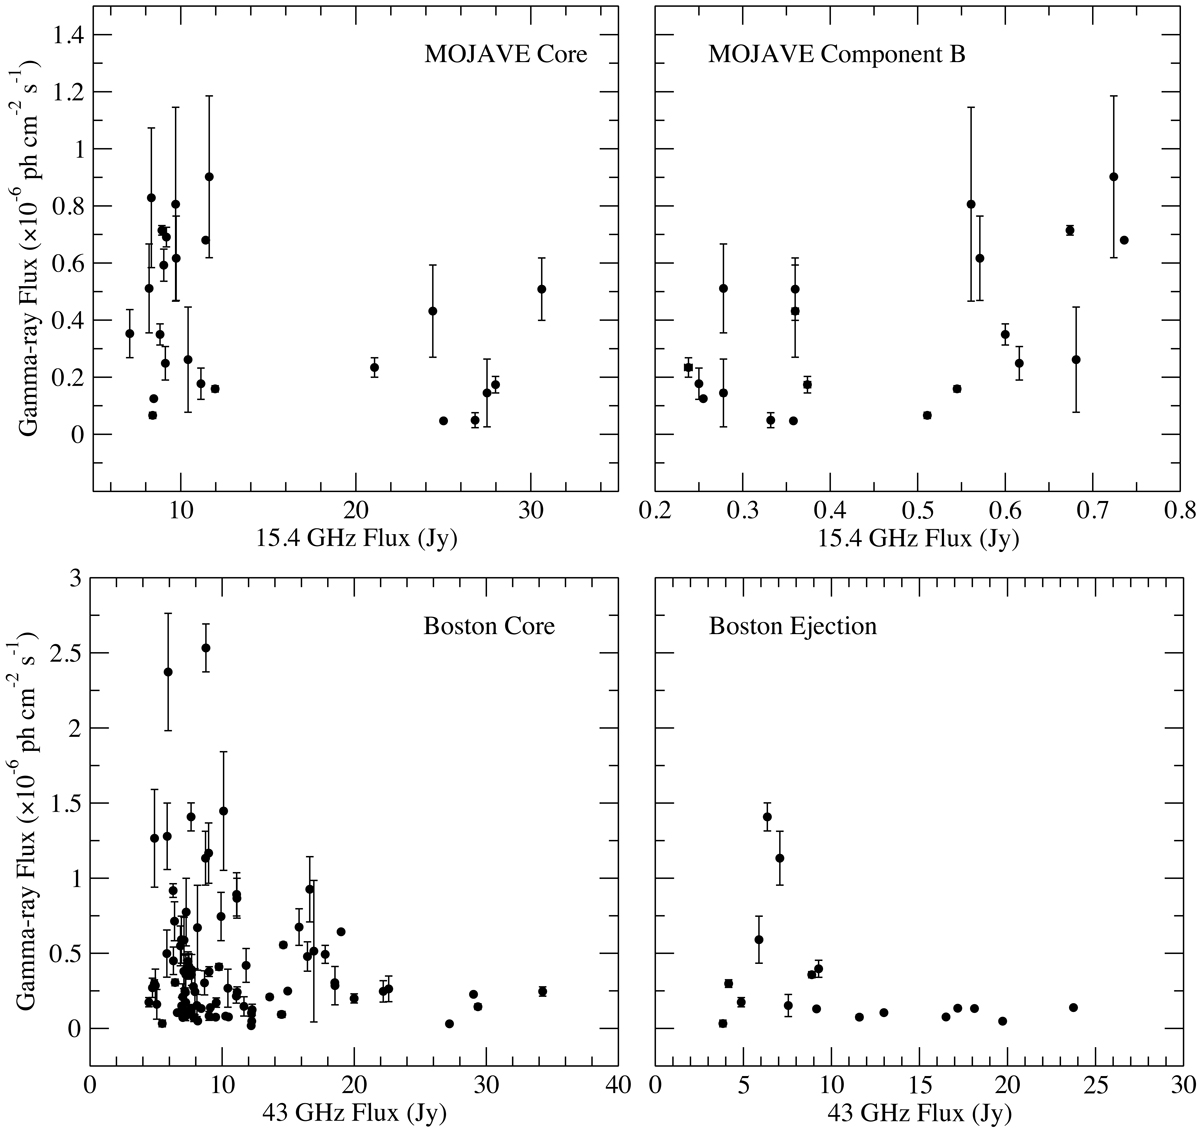
Top left panel: gamma-ray flux vs. radio flux for the core in the MOJAVE maps. Top right panel: gamma-ray flux vs. radio flux for component B in the MOJAVE maps. Bottom left panel: gamma-ray flux vs. radio flux for the core in the BU-VLBA maps. Bottom right panel: gamma-ray flux vs. radio flux for C31 in the BU-VLBA maps.
Current usage metrics show cumulative count of Article Views (full-text article views including HTML views, PDF and ePub downloads, according to the available data) and Abstracts Views on Vision4Press platform.
Data correspond to usage on the plateform after 2015. The current usage metrics is available 48-96 hours after online publication and is updated daily on week days.
Initial download of the metrics may take a while.