Open Access
Fig. 1.
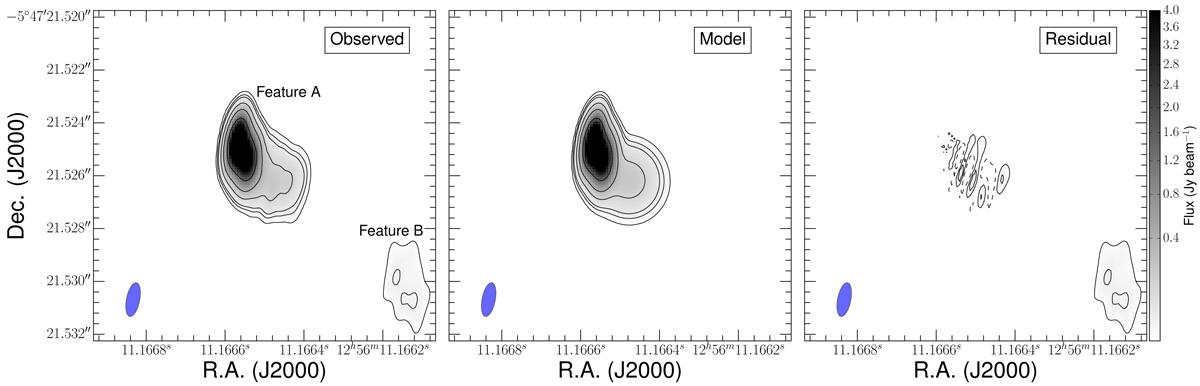
Left panel: 15 GHz VLBA intensity map from the MOJAVE observation of July 16, 2016. Middle panel: model of feature A using 2D Gaussian components. Right panel: residual image. Feature B is visible in the bottom right corner of the map.
Current usage metrics show cumulative count of Article Views (full-text article views including HTML views, PDF and ePub downloads, according to the available data) and Abstracts Views on Vision4Press platform.
Data correspond to usage on the plateform after 2015. The current usage metrics is available 48-96 hours after online publication and is updated daily on week days.
Initial download of the metrics may take a while.