Fig. 8
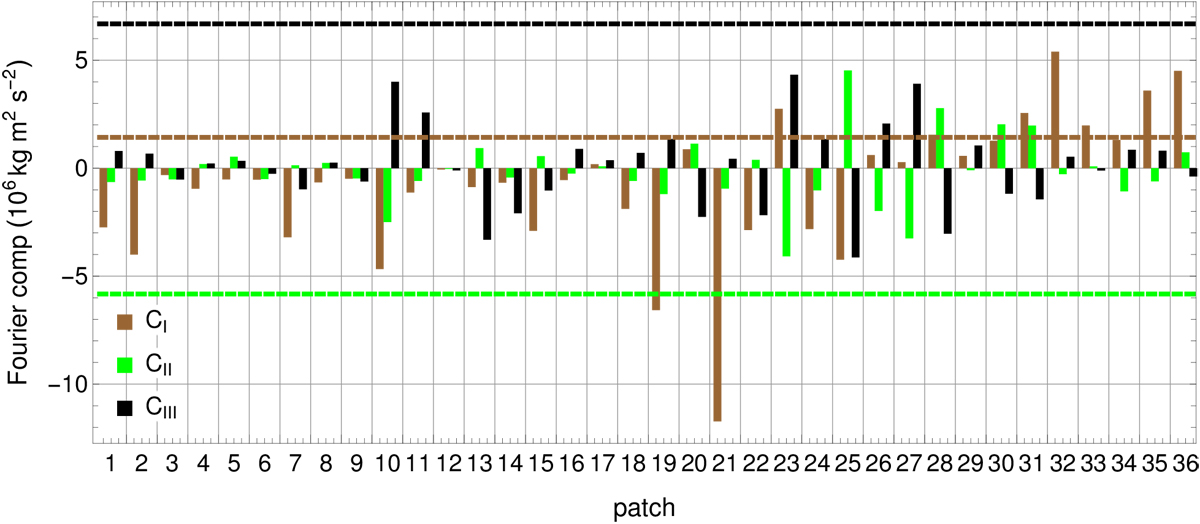
Influence of the different surface areas on the torque evolution for a uniform active surface. Shown are the extrema of the Fourier torque components for each surface patch (see Fig. 10 for the patch boundaries). Model P seeks linear combinations of patches that in sum match the extrema derived from the observation, indicated by the dashed lines.
Current usage metrics show cumulative count of Article Views (full-text article views including HTML views, PDF and ePub downloads, according to the available data) and Abstracts Views on Vision4Press platform.
Data correspond to usage on the plateform after 2015. The current usage metrics is available 48-96 hours after online publication and is updated daily on week days.
Initial download of the metrics may take a while.