Fig. 7
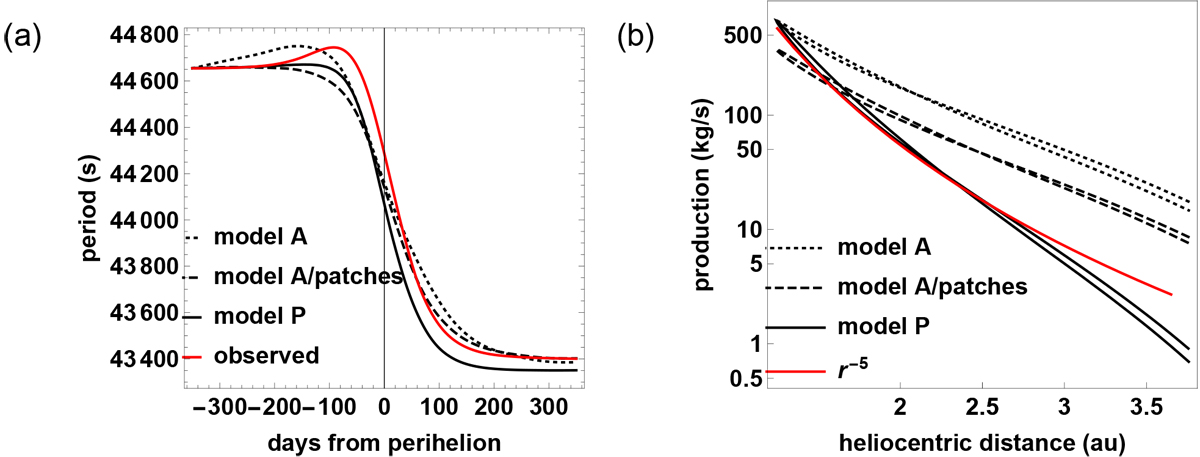
Rotation period and total water production. The red line shows the observation, and the black lines the different sublimation models. Model A with globally constant surface active fraction (1∕12), model A/patches with best-fit adjustment of patches, and model P with effective sublimation curve and best-fit adjustment of patches. In all cases, the rotation period agrees reasonably well with observations. The total water production rate drops for model A and model A/patches scenarios with ![]() , while observations indicate
, while observations indicate ![]() .
.
Current usage metrics show cumulative count of Article Views (full-text article views including HTML views, PDF and ePub downloads, according to the available data) and Abstracts Views on Vision4Press platform.
Data correspond to usage on the plateform after 2015. The current usage metrics is available 48-96 hours after online publication and is updated daily on week days.
Initial download of the metrics may take a while.