Fig. 11
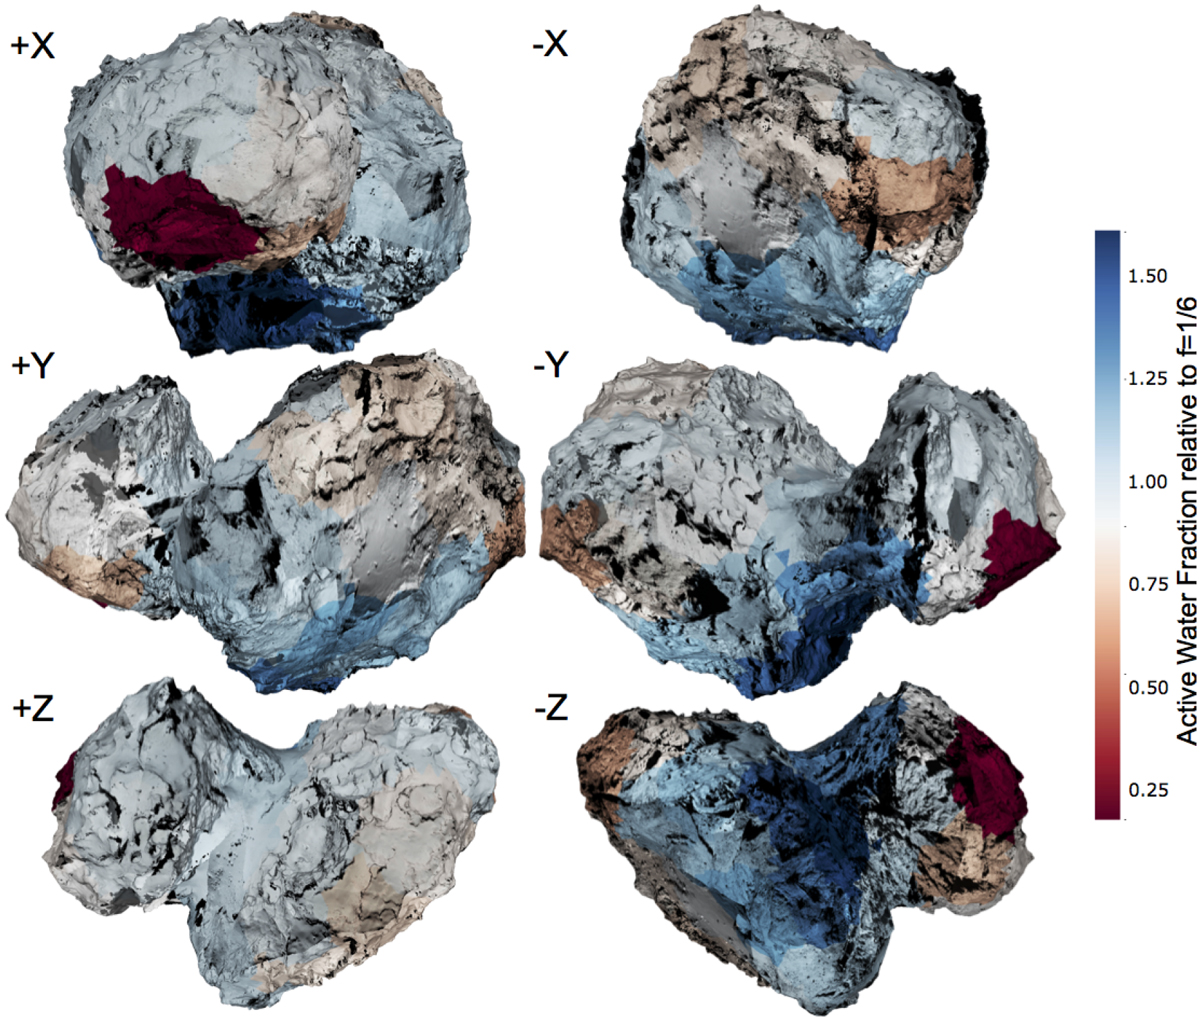
Surface active fraction map projected onto the DLR SHAP7 shape model (Preusker et al. 2017). The shape has been textured using 30 OSIRIS NAC images acquired during the SHAP4S and SHAP5 mission phases for the norther hemisphere and the SHAP7 and SHAP8 mission phases for the southern hemisphere. The color overlay shows the active surface fraction from Fig. 10 with the view vector indicated by the basis vectors X, Y, Z in the body frame.
Current usage metrics show cumulative count of Article Views (full-text article views including HTML views, PDF and ePub downloads, according to the available data) and Abstracts Views on Vision4Press platform.
Data correspond to usage on the plateform after 2015. The current usage metrics is available 48-96 hours after online publication and is updated daily on week days.
Initial download of the metrics may take a while.