Fig. 8.
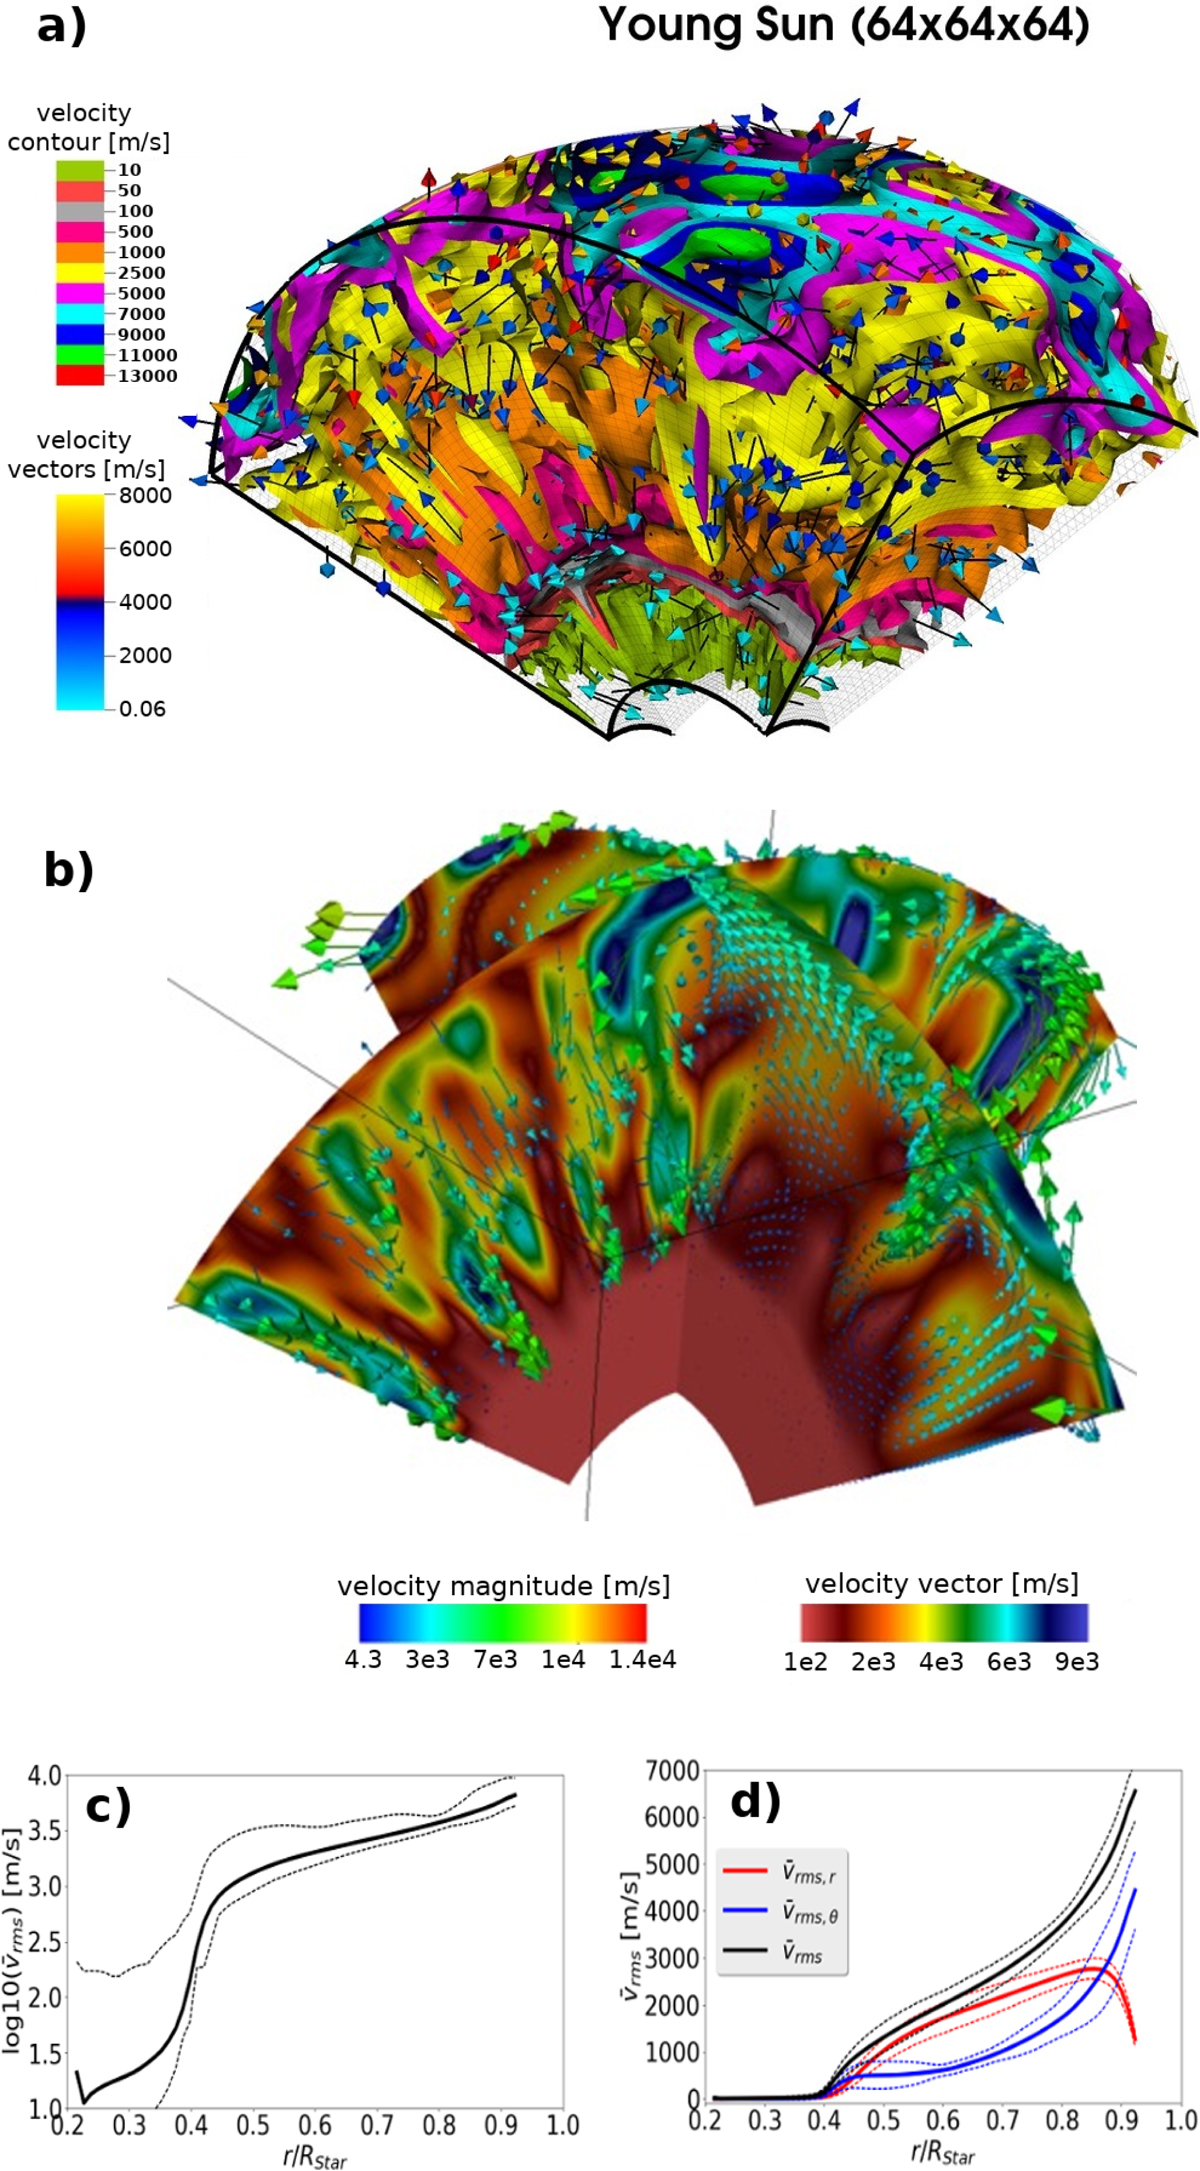
Young sun simulation in 3D, 643 mesh. Panel a: surfaces of constant velocity along with velocity arrows. Panel b: slices along the equator and perpendicular to the equator. Shown is velocity magnitude (color coded) along with velocity arrows (arrows color coded according to velocity magnitude). Bottom panels: radial profiles of vrms (panel c, logarithmic scale) and of vrms split into radial and tangential components (panel d, total vrms also shown). Solid lines show time averages, the range (minimum to maximum) is indicted by dotted lines.
Current usage metrics show cumulative count of Article Views (full-text article views including HTML views, PDF and ePub downloads, according to the available data) and Abstracts Views on Vision4Press platform.
Data correspond to usage on the plateform after 2015. The current usage metrics is available 48-96 hours after online publication and is updated daily on week days.
Initial download of the metrics may take a while.