Fig. 3.
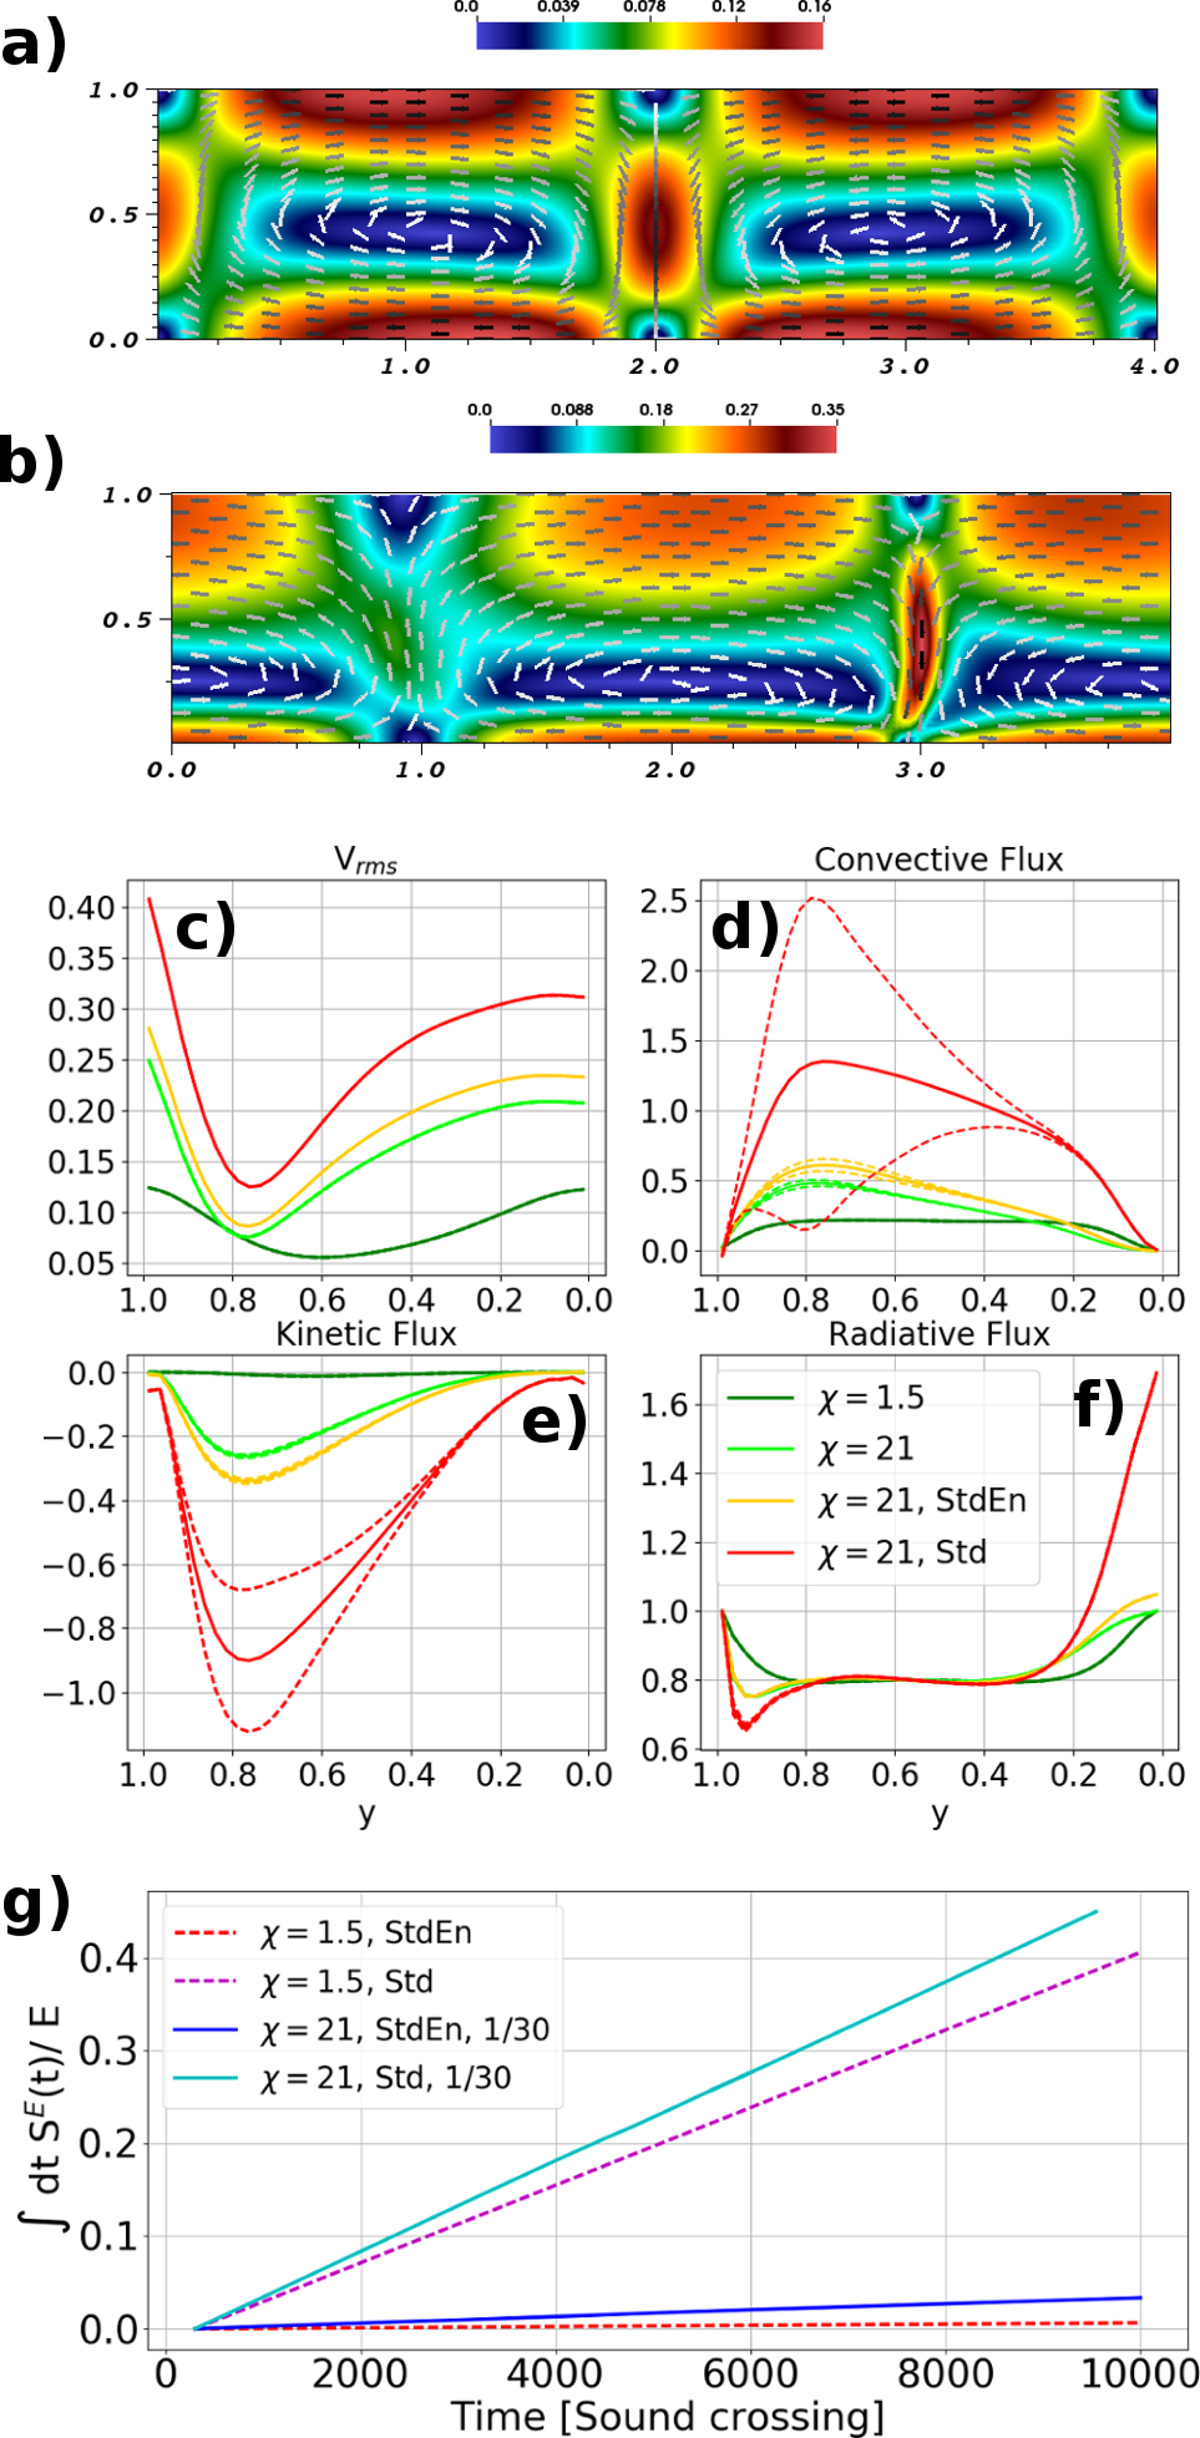
Test case following H84. Typical flow patterns for χ = 1.5 and χ = 21 are shown in panels a and b, respectively, in (dimensionless) absolute velocity (color coded) with velocity arrows superimposed. Horizontally averaged vertical profiles of vrms, convective (FC), kinetic (FK), and radiative (FR) fluxes are given in panels c–f. Colors denote solutions obtained with the well-balanced scheme for χ = 1.5 (dark green) and χ = 21 (light green), with the well-balanced scheme but central differences for SE and χ = 21 (yellow), and with the standard scheme for χ = 21 (red). Solid lines are time averages, dashed lines are temporal variability (±1 standard deviation, where distinguishable from the mean). Panel g: time integrated gain of energy via SE if the scheme is not well balanced in energy (red dashed and blue solid) or if the standard scheme (purple dashed and cyan solid) is used for χ = 1.5 (dashed lines) and χ = 21 (solid lines, scaled by a factor of 30).
Current usage metrics show cumulative count of Article Views (full-text article views including HTML views, PDF and ePub downloads, according to the available data) and Abstracts Views on Vision4Press platform.
Data correspond to usage on the plateform after 2015. The current usage metrics is available 48-96 hours after online publication and is updated daily on week days.
Initial download of the metrics may take a while.