Fig. 9
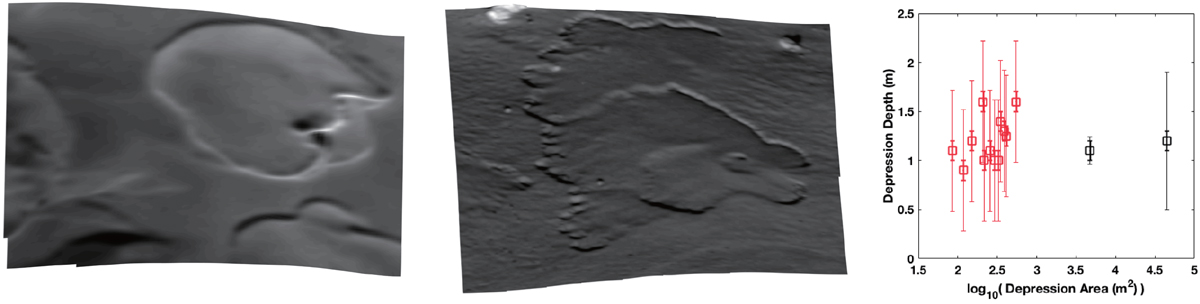
Left: DTM of the depression within Imhotep. The scale across the DTM is 361 × .433 m. Middle: DTM of the depression within Hapi. The scale across the DTM is 110 × 160 m. Right: depression depths as a function of their area. All depressions appear to range from 50 cm to 1.5 m in depth. Points in red are measured from Birch et al. (in prep.), and those in black are measured from the depressions in the left and middle panels. The thin error bars are as measured in Sect. 3.1, and the thick error bars represent the more realistic error inherent in our method (~10 cm). The locations on the nucleus of the regions of interest are shown in Fig. 10.
Current usage metrics show cumulative count of Article Views (full-text article views including HTML views, PDF and ePub downloads, according to the available data) and Abstracts Views on Vision4Press platform.
Data correspond to usage on the plateform after 2015. The current usage metrics is available 48-96 hours after online publication and is updated daily on week days.
Initial download of the metrics may take a while.