Fig. 7
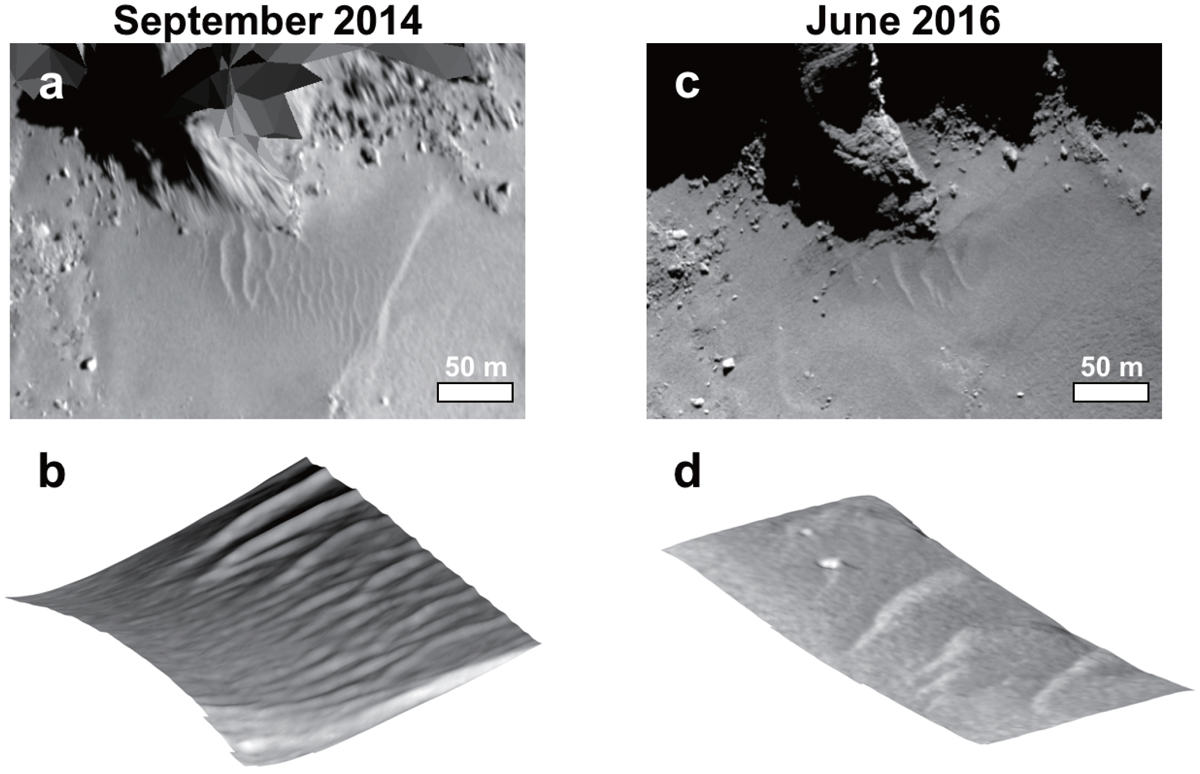
Panel a: OSIRIS NAC image of ripples within the Hapi region as imaged in September 2014. Panel b: DTM of the ripples. The top right side is removed before the DTM was generated because the cliffs of the Seth region intruded on the region of the ripples. Panel c: OSIRIS NAC image of ripples as imaged in June 2016. Fewer ripples are in the region, and they have changed location and orientation relative to the cliff. Panel d: DTM of the ripples. The location on the nucleus of the region of interest is shown in Fig. 10.
Current usage metrics show cumulative count of Article Views (full-text article views including HTML views, PDF and ePub downloads, according to the available data) and Abstracts Views on Vision4Press platform.
Data correspond to usage on the plateform after 2015. The current usage metrics is available 48-96 hours after online publication and is updated daily on week days.
Initial download of the metrics may take a while.