Fig. 1
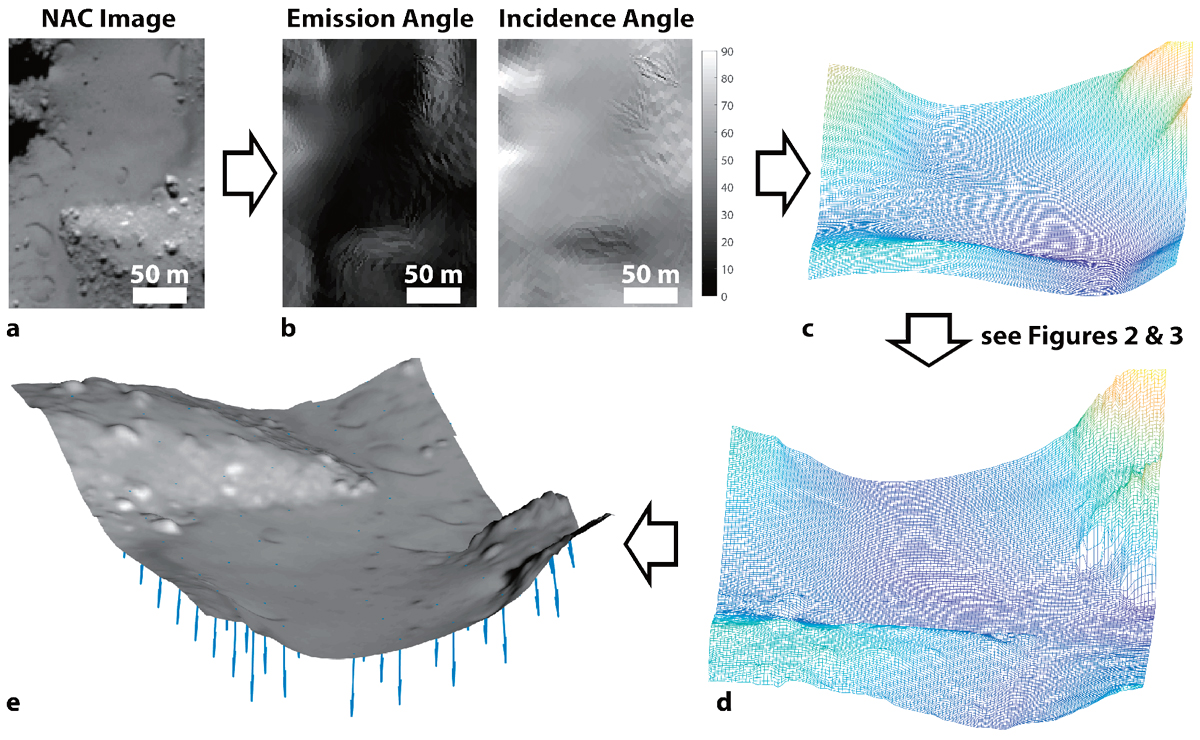
Flow chart of the photoclinometry process. We start with a selected region of a high-resolution NAC image capturing the site of interest (a). Using the NAIF SPICE toolkit, we derive the viewing geometries at this region (b), as well as an initial topology estimate from a shape model (c). We apply a photoclinometry method using the algorithm from Kirk et al. (2003) to derive a detailed topology map (d). Finally, we orthorectify the map and then calculate the local gravity (e). The final image is the topographic surface projected in 3D, with an orthorectified image overlaid on the surface. The arrows are local gravity vectors. The location on the nucleus of the region of interest is shown in Fig. 10.
Current usage metrics show cumulative count of Article Views (full-text article views including HTML views, PDF and ePub downloads, according to the available data) and Abstracts Views on Vision4Press platform.
Data correspond to usage on the plateform after 2015. The current usage metrics is available 48-96 hours after online publication and is updated daily on week days.
Initial download of the metrics may take a while.