Fig. 3
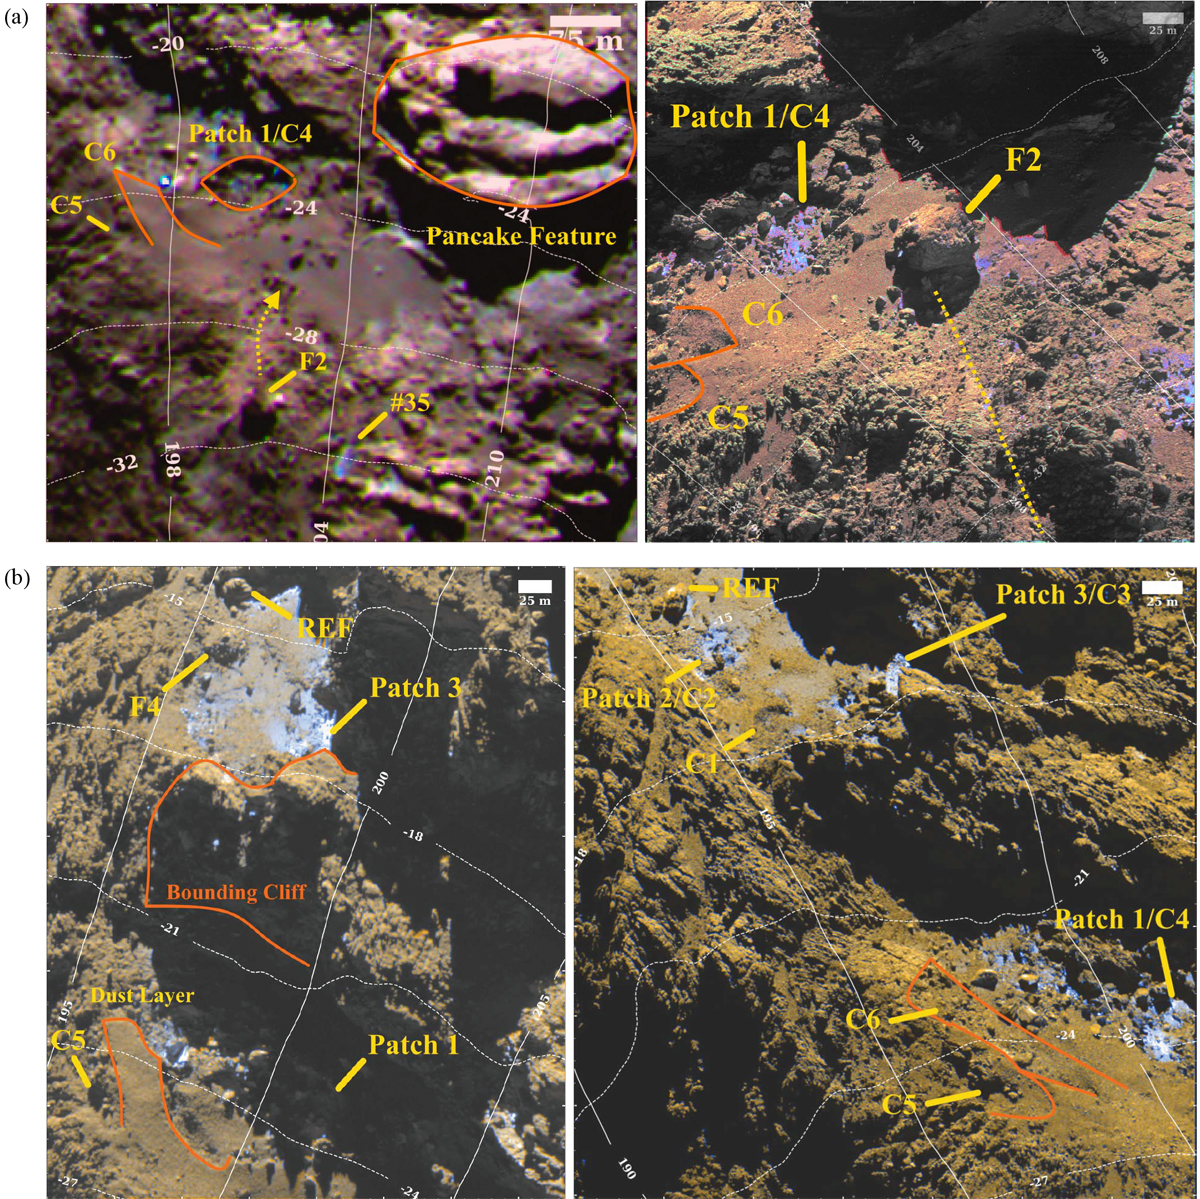
Morphological changes after perihelion passage. OSIRIS RGB composites obtained in the final Rosetta multi-instrumental campaign of 2016 next to other OSIRIS RGB composites acquired before perihelion passage of July–October 2015. Labels used here are the same as labels in Tables 3 and 2 and throughout the text. Qualitatively, RGB bluer terrains correspond to a different gradient of the flat VIS-to-NIR spectral slope. In Sect. 5 we present the quantitative estimation for the ice-enriched units. (a) May 2, 2015, UTC 15:09 (F41-F23-F24, left) and July 16, 2016, UTC 19:22 (F41-F23-F24, right). Low Khonsu bank. The symbol “←” represents the displacement of jumping boulder 1. “35” indicates the source of event 35 described in Sect. 6. (b) January 16, 2015, UTC 01:27 (F22-F22-F24, left) and June 25, 2016, UTC 18:02 (F22-F22-F24, right). Partial view of the High and Low Khonsu bank.
Current usage metrics show cumulative count of Article Views (full-text article views including HTML views, PDF and ePub downloads, according to the available data) and Abstracts Views on Vision4Press platform.
Data correspond to usage on the plateform after 2015. The current usage metrics is available 48-96 hours after online publication and is updated daily on week days.
Initial download of the metrics may take a while.