Fig. 6
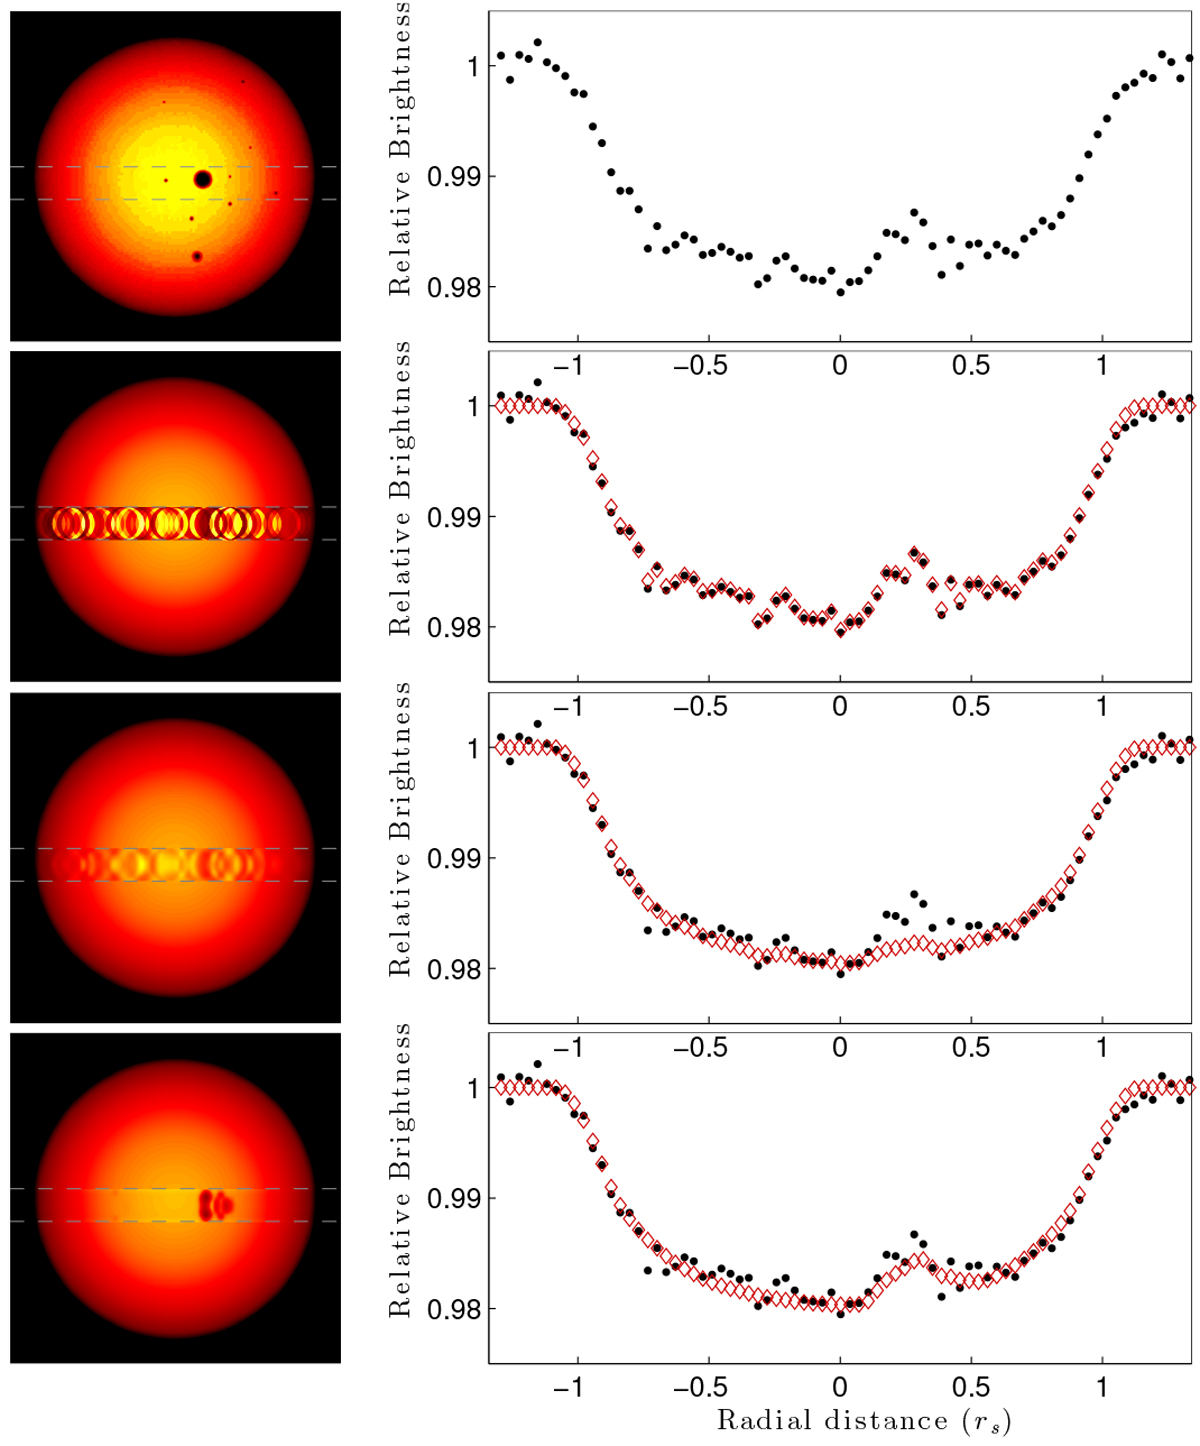
Sketching the method for mapping stellar surfaces, part 6: regularization. Rows from top to bottom are divided into a left and a right part. The left part shows a map of the stellar surface in which dashed gray lines outline the transit chord. The right part shows the corresponding light curves. Black dots show the observations, and red diamonds show the synthetic light curve that the surface map to the left produces. First row from the top: to the left is the stellar map that was used to simulate observations. Our aim is to recover a map that resembles this. To the right is the observed light curve, including observational noise. Second row: recovered stellar map and corresponding light curve without anyregularization. This is the end product of the process described in Sect. 2.3. In this case, the noise has been interpreted as bright and dark regions on the stellar surface. Third row: recovered stellar surface and corresponding light curve after applying regularization with a flat weight-map. Variations due to noise have been reduced by the regularization, but can still be seen as faint bright and dark regions. The true spot is faint because the regularization causes the solution to become smoother. Fourth row: recovered map and corresponding light curve after regularization with a dynamic weight-map, where weights are chosen such that they are low in regions where deviations from the reference case are within what can be expected from the noise levels. Now the bright and dark regions due to noise are nolonger visible, and the dark region corresponding to the true spot is clearly visible, although its shape is slightly altered.
Current usage metrics show cumulative count of Article Views (full-text article views including HTML views, PDF and ePub downloads, according to the available data) and Abstracts Views on Vision4Press platform.
Data correspond to usage on the plateform after 2015. The current usage metrics is available 48-96 hours after online publication and is updated daily on week days.
Initial download of the metrics may take a while.