Fig. 5
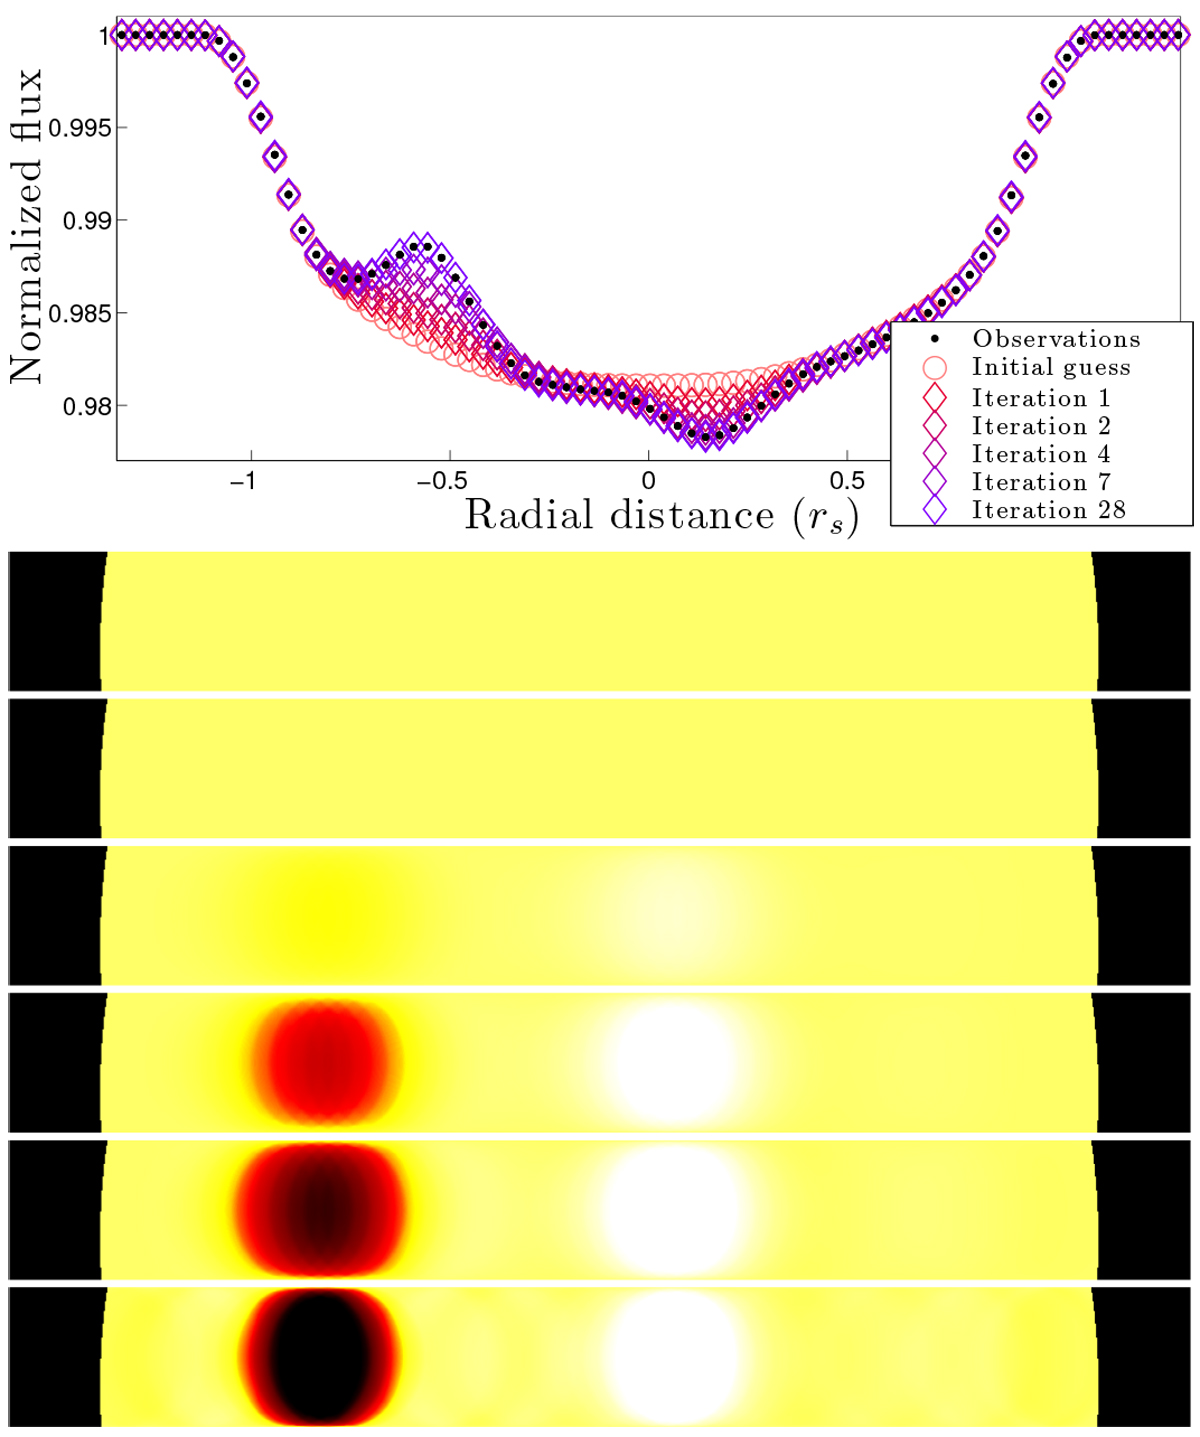
Sketching the method for mapping stellar surfaces, part 5: converging on the solution. Upper panel: light curves. The observed light curve is shown as black dots. The initial guess based on the spot-free map of the stellar surface is shown as pink circles. Diamonds from red to purple show the light curves at five stages in the iterative process, which are chosen to show the progress as clearly as possible. We start just after the first iteration (red) and end when convergence is found (purple). Lower panels: maps of the stellar surface that were used to synthesize the light curves are shown in the upper panel. Only part of the stellar disk is shown, the transit chord. From top to bottom panels: initial guess (i.e., spot-free reference case), and iterations 1, 2, 4, 7, and 28.
Current usage metrics show cumulative count of Article Views (full-text article views including HTML views, PDF and ePub downloads, according to the available data) and Abstracts Views on Vision4Press platform.
Data correspond to usage on the plateform after 2015. The current usage metrics is available 48-96 hours after online publication and is updated daily on week days.
Initial download of the metrics may take a while.