Fig. 2
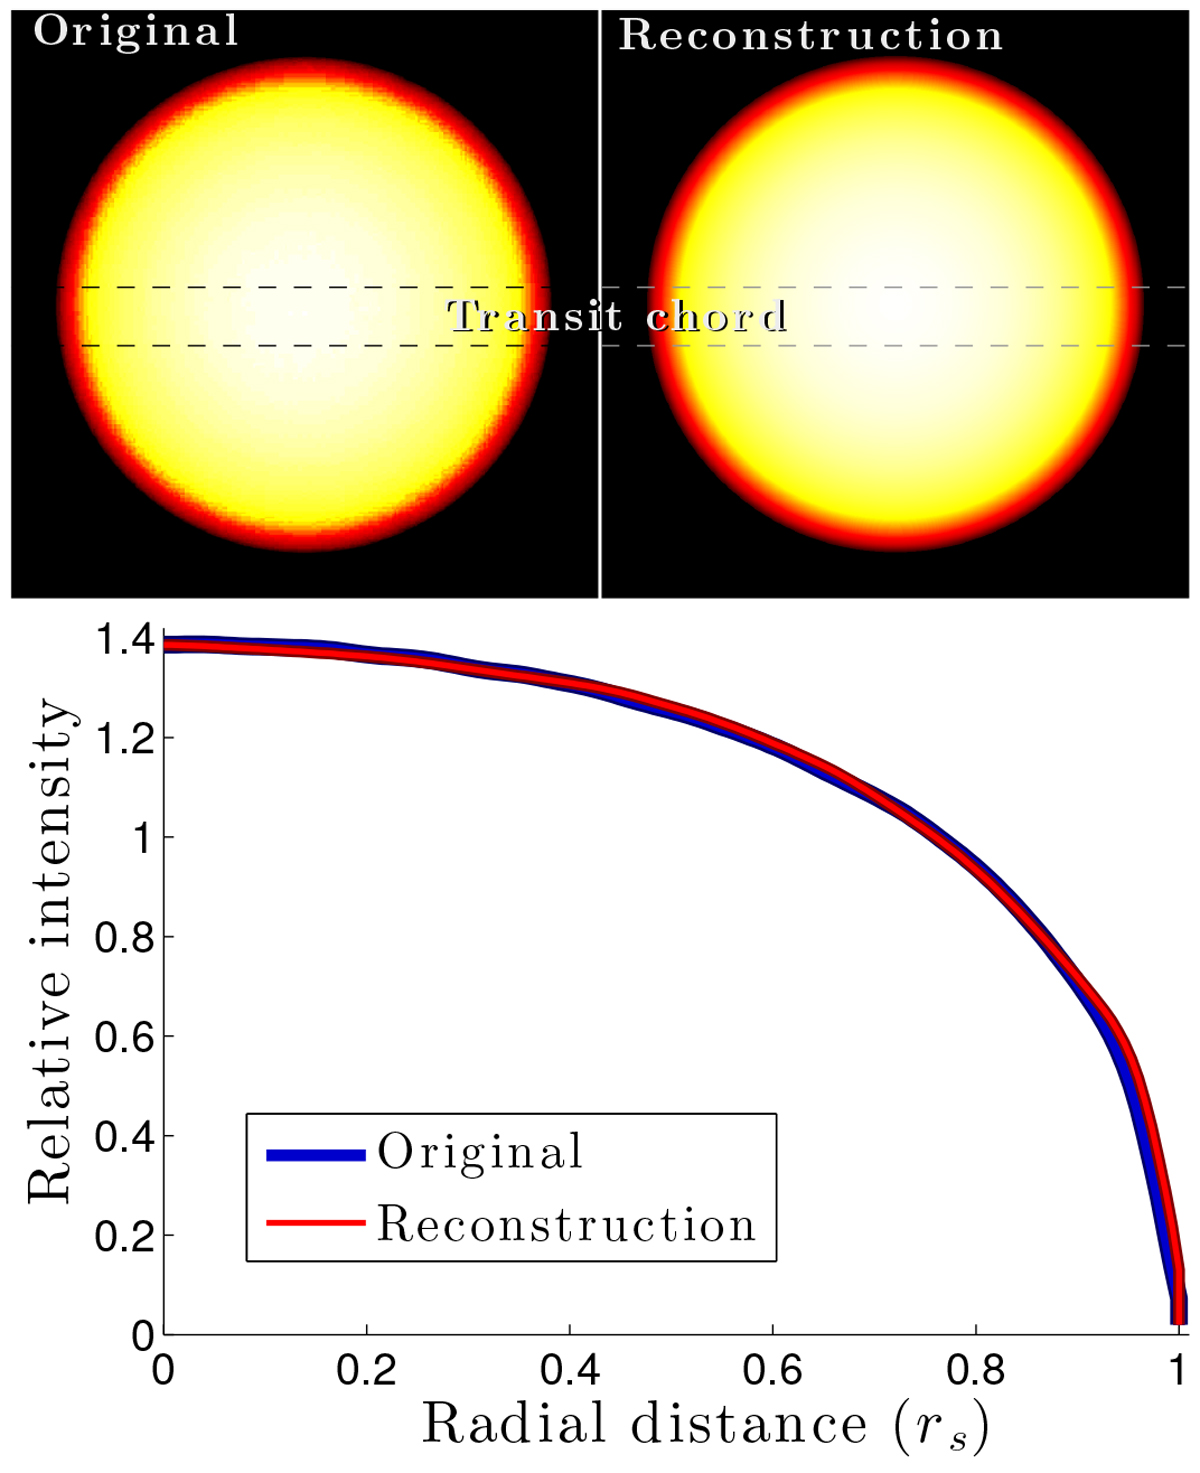
Sketching the method for mapping stellar surfaces, part 2: creating the initial guess for stellar surface brightness distribution. Upper row: maps of the spot-free reference stellar surface. The left figure is the original that was used to create the synthetic observations that Iref was then fitted to. The right figure is the reconstruction of the stellar surface using Iref. Lower panel: stellar specific intensities. The best-fitting specific intensity to the median-combined light curve (Iref) is shown as a red line. This function was used to reconstitute the stellar map (upper right figure). The“true” original specific intensity of the star is shown as a blue line.
Current usage metrics show cumulative count of Article Views (full-text article views including HTML views, PDF and ePub downloads, according to the available data) and Abstracts Views on Vision4Press platform.
Data correspond to usage on the plateform after 2015. The current usage metrics is available 48-96 hours after online publication and is updated daily on week days.
Initial download of the metrics may take a while.