Fig. 13
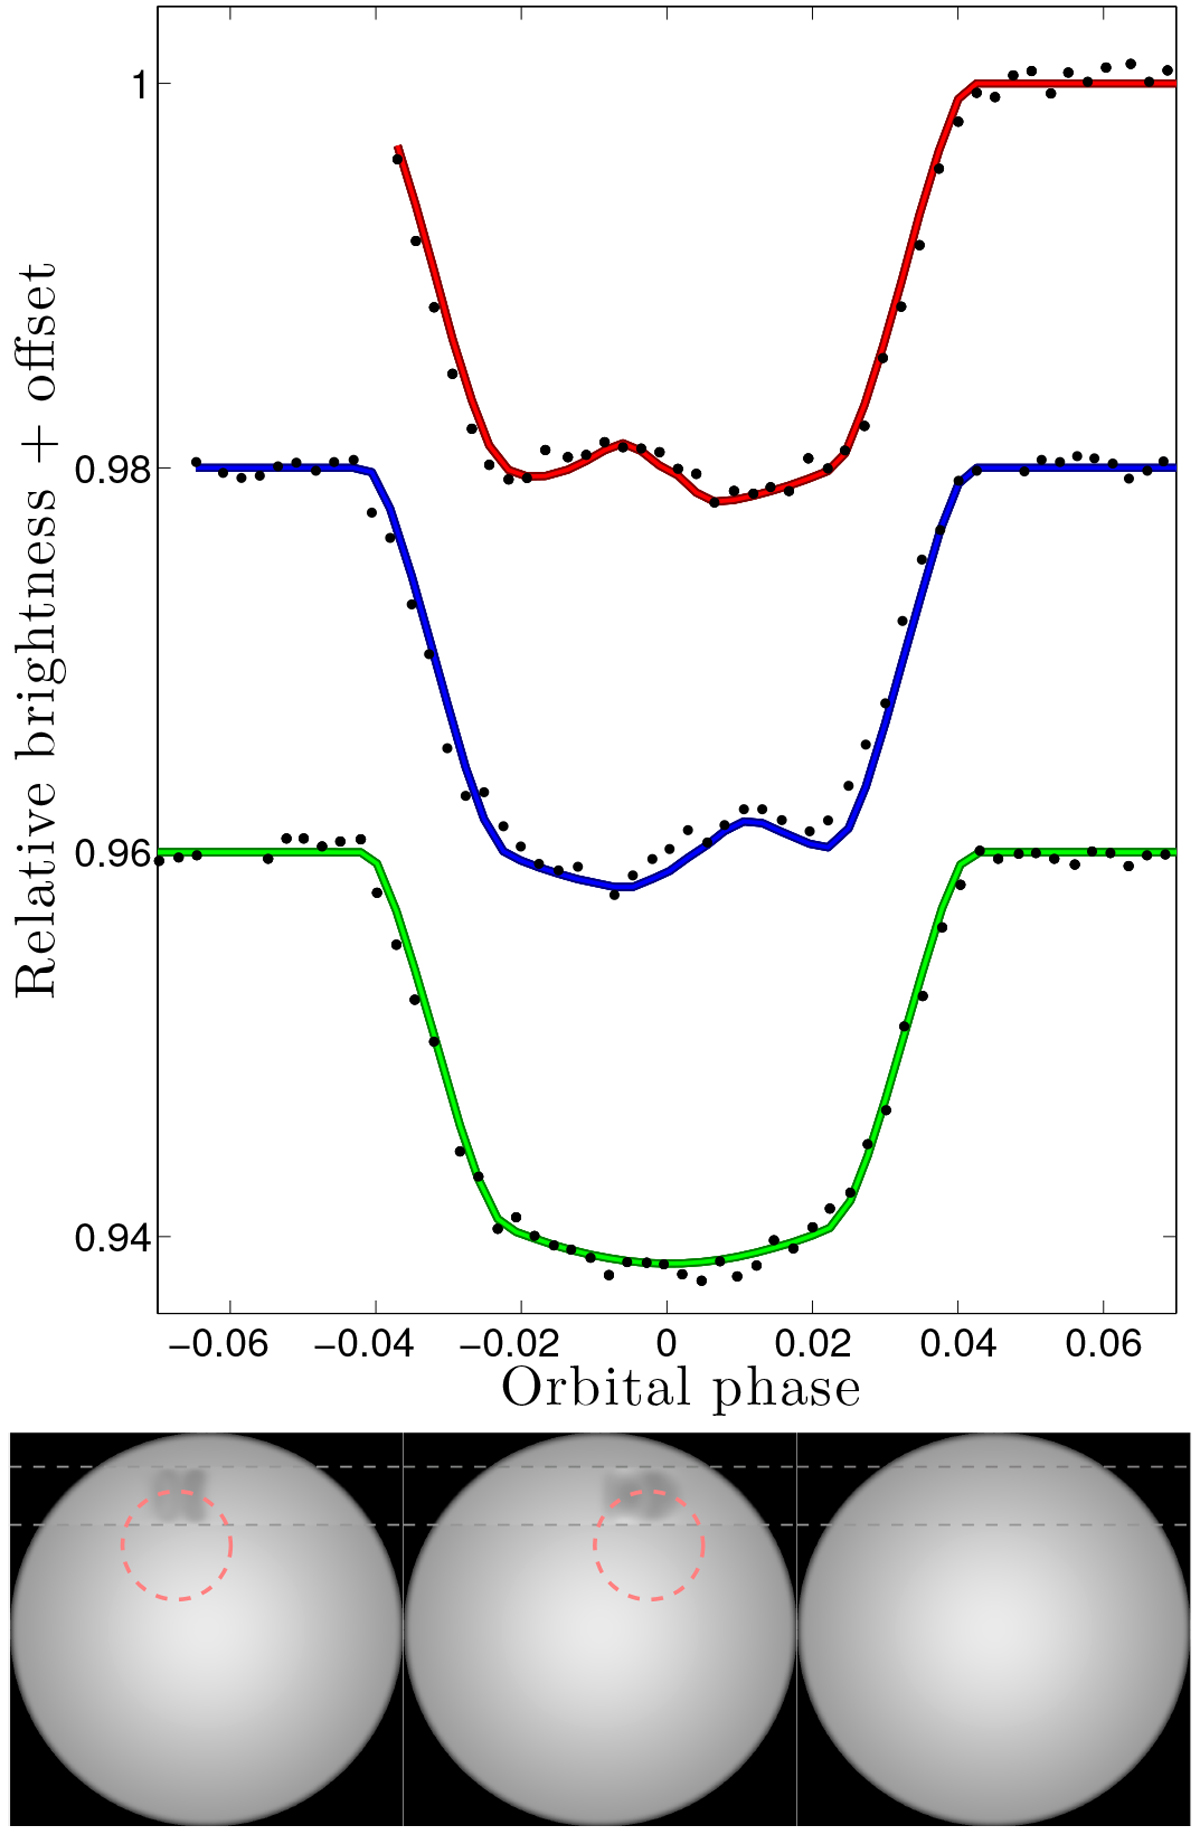
Our method applied to WASP-19 data. This is the same data as were used to test the PRISM code (Tregloan-Reed et al. 2013). Upper panel: observed light curves of three transit events shown as black dots, and the light curves produced by our recovered stellar maps is shown as solid lines. Bottom panel: recovered stellar maps. The left map corresponds to the red light curve in the upper panel. The central map corresponds to blue light curve, and the right map corresponds to the green light curve. Star spots were detected in the recovered maps from the first two transit events. The dashed red circle shows the size and position of the spots detected with the PRISM code.
Current usage metrics show cumulative count of Article Views (full-text article views including HTML views, PDF and ePub downloads, according to the available data) and Abstracts Views on Vision4Press platform.
Data correspond to usage on the plateform after 2015. The current usage metrics is available 48-96 hours after online publication and is updated daily on week days.
Initial download of the metrics may take a while.