Fig. 1
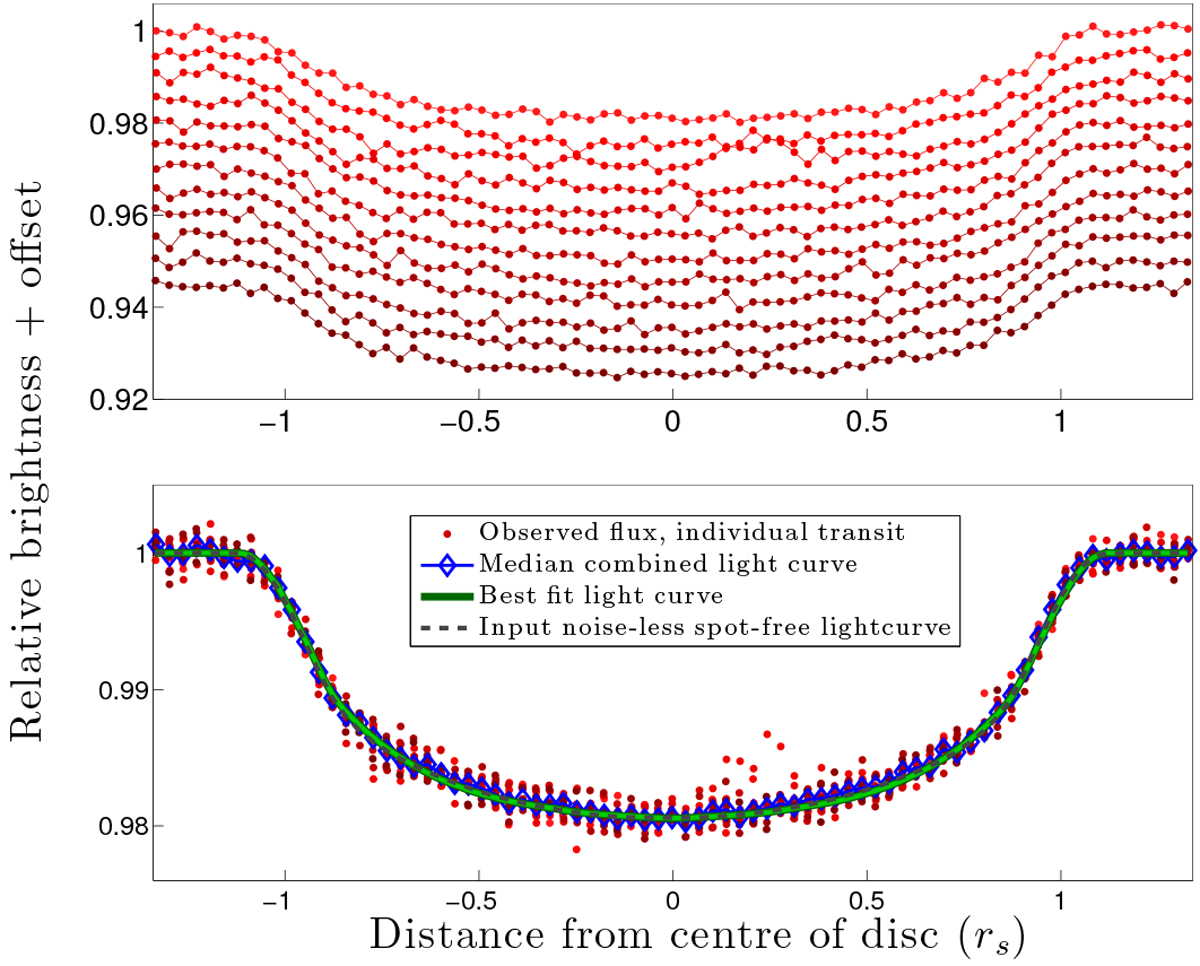
Sketching the method for mapping stellar surfaces, part 1: spot-free light curve. Upper panel: 12 consecutive (synthetic) transit light curves. Noise levels are comparable with what is expected to be routinely achieved by the Transiting Exoplanet Survey Satellite (TESS), see Sect. 3.1. Lower panel: 12 transits phase-folded (red dots) and median-combined (blue diamonds). The best fit to the median-combined light curve is shown as a solid green line. The input model used to synthesize the light curves is shown as a dashed black line.
Current usage metrics show cumulative count of Article Views (full-text article views including HTML views, PDF and ePub downloads, according to the available data) and Abstracts Views on Vision4Press platform.
Data correspond to usage on the plateform after 2015. The current usage metrics is available 48-96 hours after online publication and is updated daily on week days.
Initial download of the metrics may take a while.