Free Access
Fig. 4
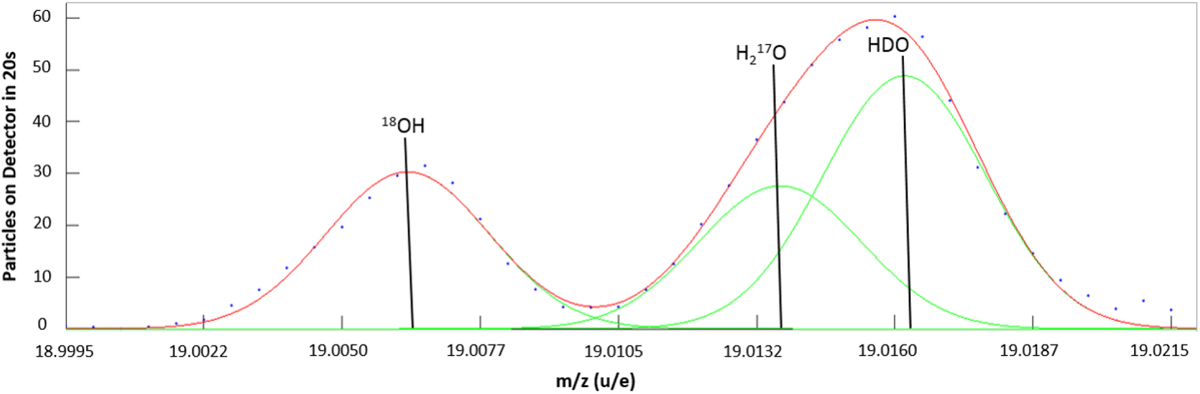
Sample DFMS mass spectrum from 2016-03-03 T 03:45 illustrating the use of manual peak-fitting with equal-width Gaussians toseparate the H217O peak from that of HDO. Dotted line: mass spectrum, green lines: fitted Gaussians, red line: sum of fitted Gaussians.
Current usage metrics show cumulative count of Article Views (full-text article views including HTML views, PDF and ePub downloads, according to the available data) and Abstracts Views on Vision4Press platform.
Data correspond to usage on the plateform after 2015. The current usage metrics is available 48-96 hours after online publication and is updated daily on week days.
Initial download of the metrics may take a while.