Fig. 8
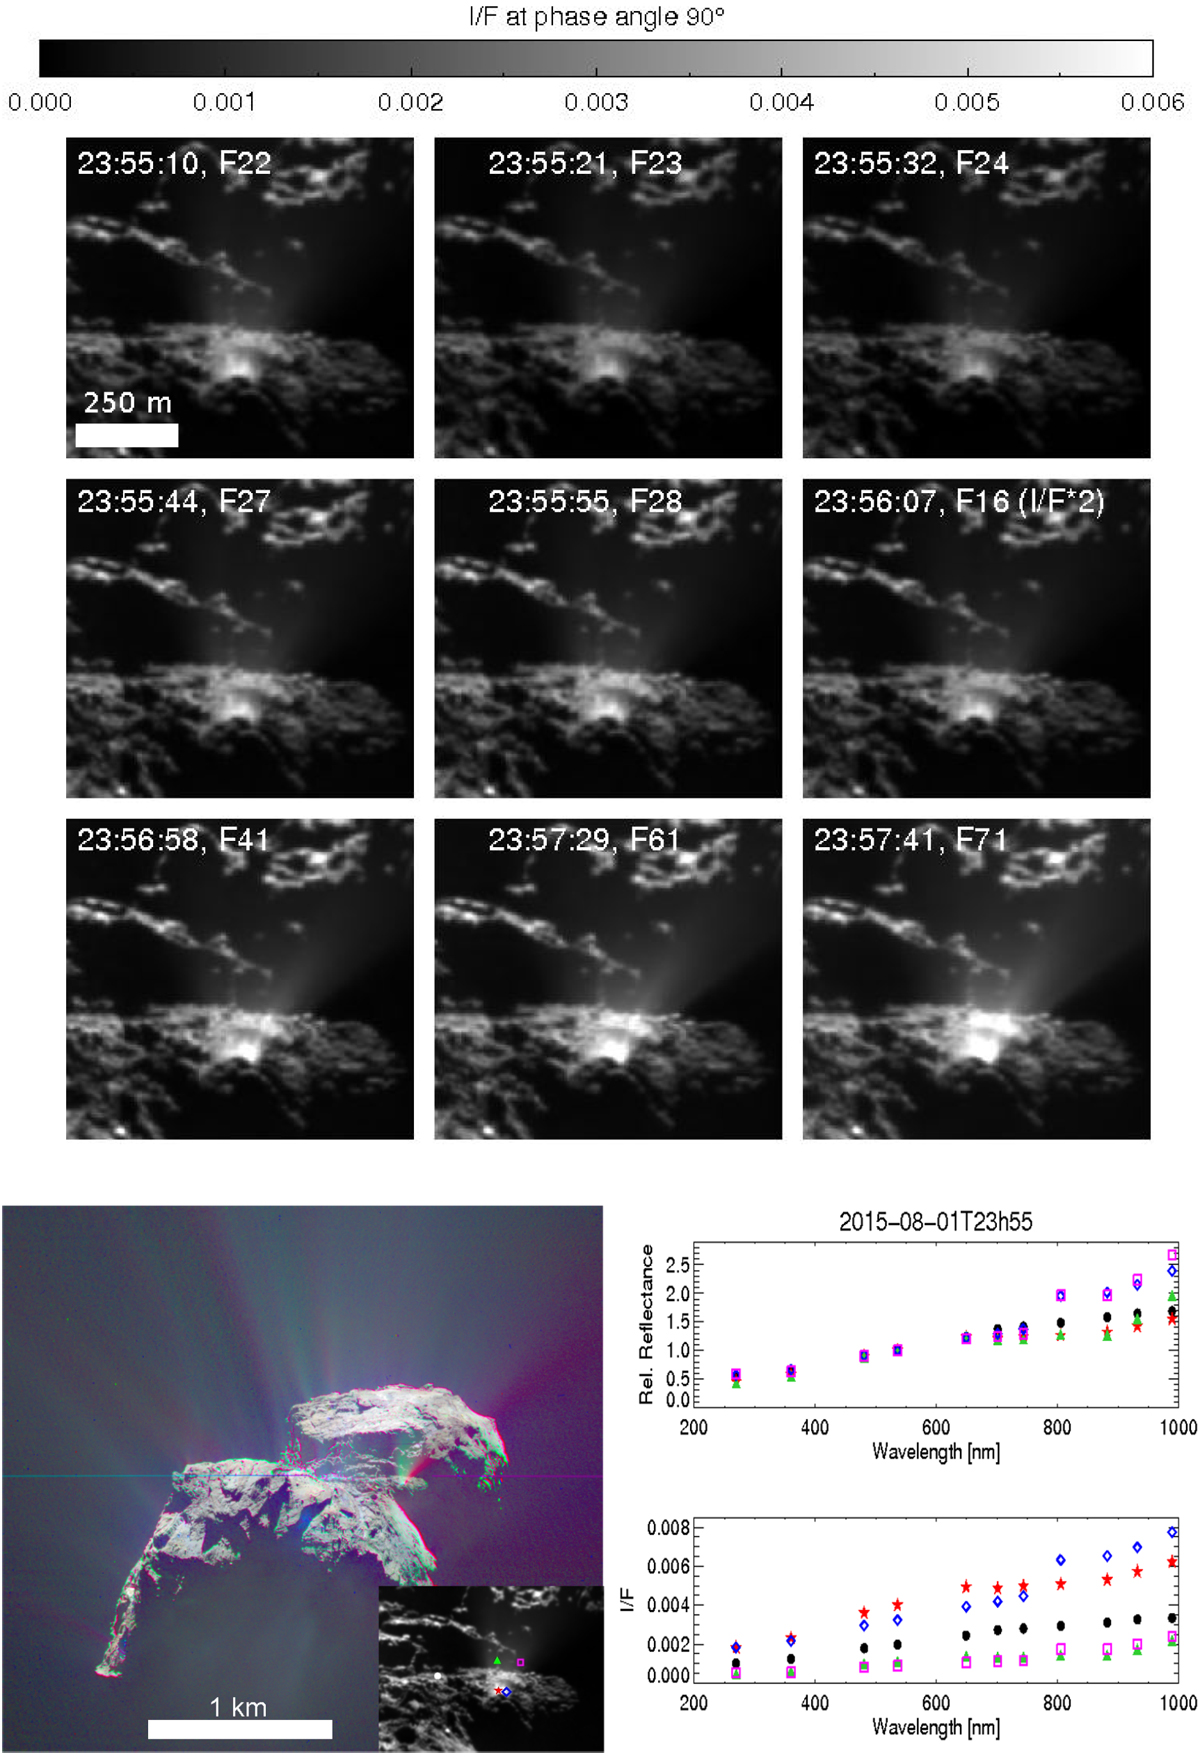
Top panel: nine of the eleven images of the sequence obtained on 1 August 2015 acquired at 23h55, showing the flux variation over time from a jet with two close sources (jet 178 in Table A.1). The I/F flux acquired with the F16 (centered at 360 nm) has been doubled to be correctly shown with the given intensity scale. Bottom left panel: RGBimages showing the double jet. The inset shows a zoom of the active region (in the F22 filter) with the five selectedROIs along the jet and on the comet nucleus (the white circle on the left side of the jet). Bottom right panel: spectrophotometry and I/F of the five ROI (the nucleus DT is represented with a black circle). The horizontal line approximately in the middle of the RGB image is a residual of the combination of image subunits (an individual coregistration of three subregions of the full field of view was needed to improve the coregistration), and is and artifact.
Current usage metrics show cumulative count of Article Views (full-text article views including HTML views, PDF and ePub downloads, according to the available data) and Abstracts Views on Vision4Press platform.
Data correspond to usage on the plateform after 2015. The current usage metrics is available 48-96 hours after online publication and is updated daily on week days.
Initial download of the metrics may take a while.