Fig. 7
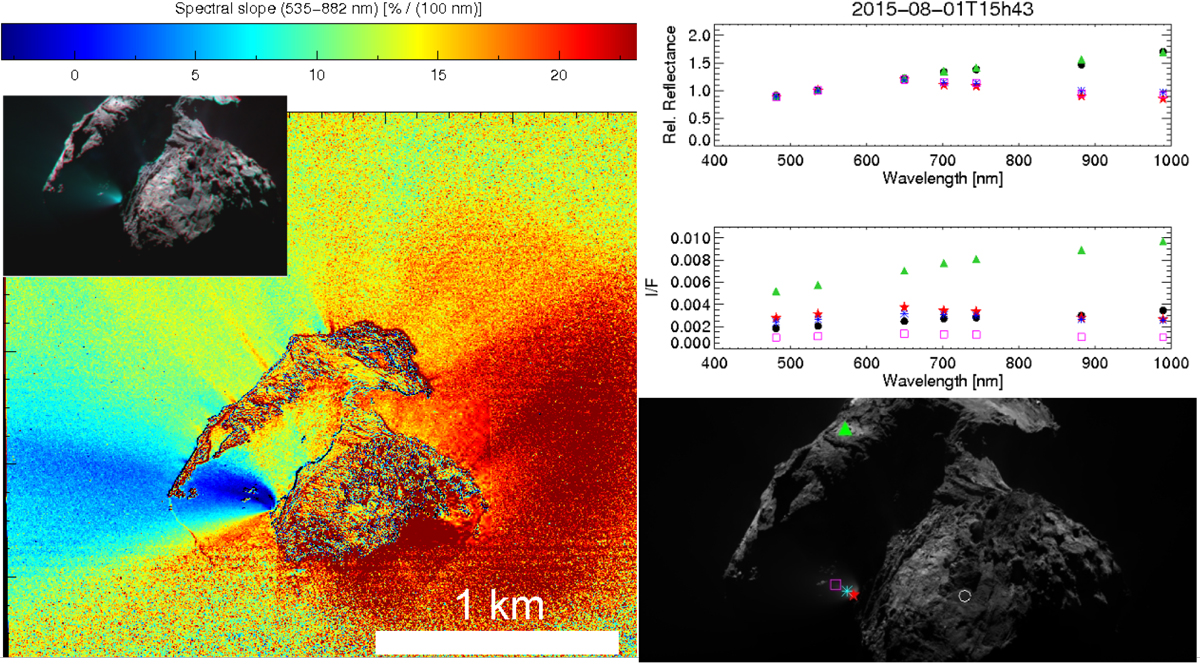
Left panel: slope of the spectra and RGB images from data obtained on 1 August acquired at 15h43, showing a jet in the shadows that departs from the Sobek region (jet 177 in Table A.1). Right panel: relative reflectance and I/F of the five ROI. The I/F of three positions on the jet (red star, cyan asterisk, and magenta square) is not corrected for the disk function because incidence and emission angle are not reliable in shadowed regions.
Current usage metrics show cumulative count of Article Views (full-text article views including HTML views, PDF and ePub downloads, according to the available data) and Abstracts Views on Vision4Press platform.
Data correspond to usage on the plateform after 2015. The current usage metrics is available 48-96 hours after online publication and is updated daily on week days.
Initial download of the metrics may take a while.