Fig. 6
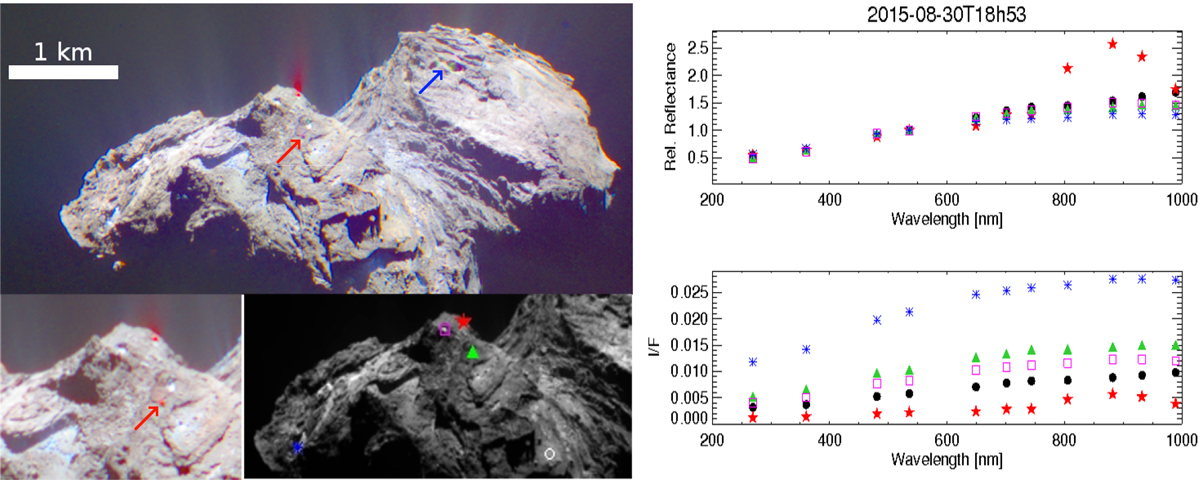
Analysis of images obtained on 30 August 2015 at 18h51–18h54. Top left: RGB color image (composed from filters centered at 882, 649, and 480 nm) showing a red jet (jet 123 in Table A.1) departing from a bright spot, as well as other faint jets that are indicated by the arrows. In particular, the cavity seen to be active at 6h49 on the same day still shows a very faint jet (jet 71 in Table A.1) that is indicated by the red arrow. Bottom left: zoom into the region around the red jet in RGB colors produced with filters centered at 931, 649, and 480 nm; a faint jet departing from the 6h49 source can be visualized better, and the fainter flux of the red jet compared to the RGB in the top panel (the acquisition order of the filter was 269, 360, 743, 701, 480, 535, 649, 989, 931, 805, and 882 nm). Bottom center: image with symbols related to the five ROI. Right panels: relative reflectance, normalized at 535 nm, vs. wavelength, and the reflectance at phase = 70° of five selected ROI (the red circle shows the dark terrain of the comet, the red star represents the red jet highlighted in the zoom, the blue asterisk shows a bright patch in Khonsu at which activity was previously observed, and the green triangle andmagenta square indicate two different bright patches).
Current usage metrics show cumulative count of Article Views (full-text article views including HTML views, PDF and ePub downloads, according to the available data) and Abstracts Views on Vision4Press platform.
Data correspond to usage on the plateform after 2015. The current usage metrics is available 48-96 hours after online publication and is updated daily on week days.
Initial download of the metrics may take a while.