Fig. 3
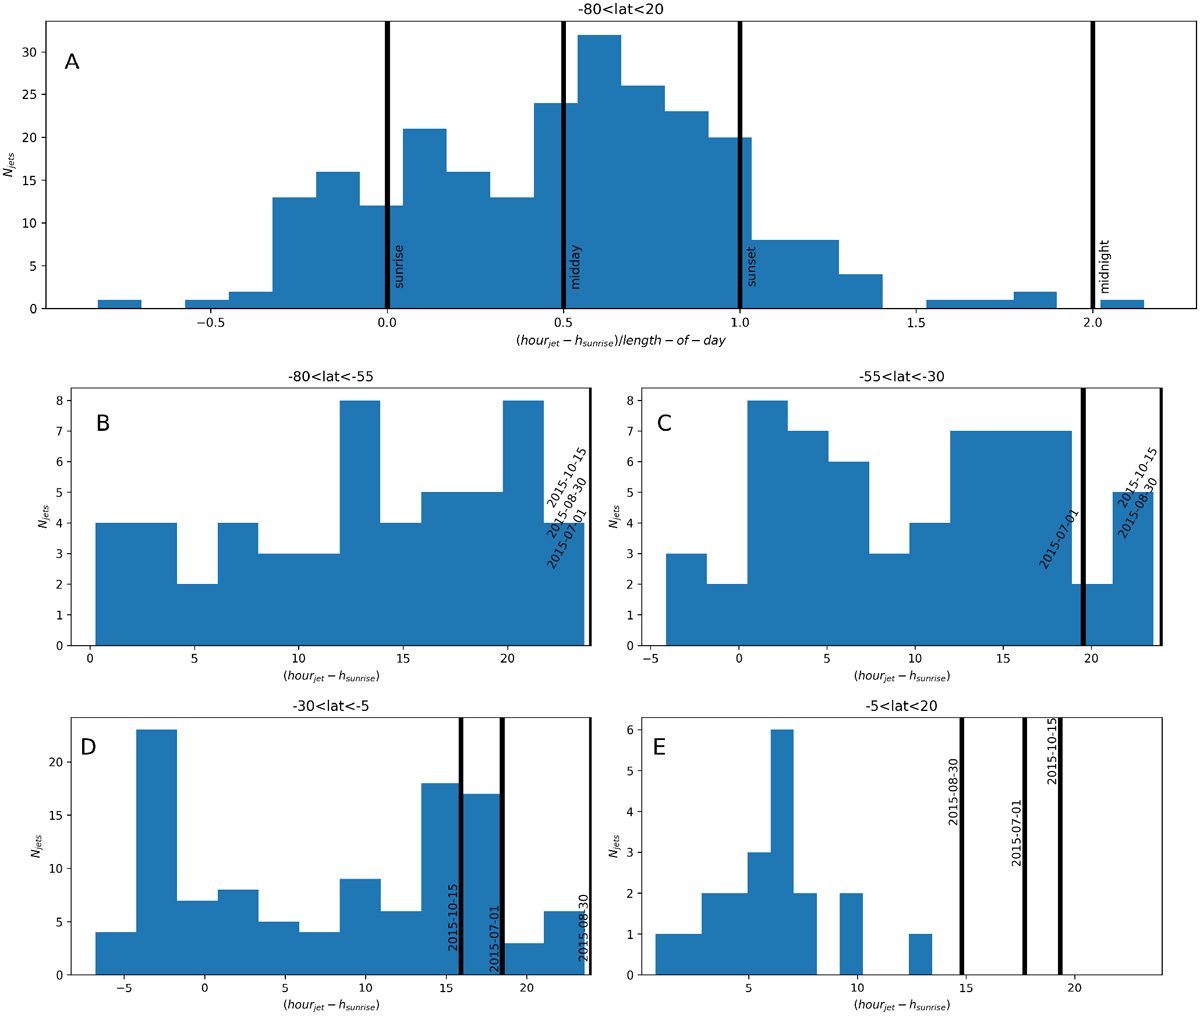
Panel A: total number of observed jets observed as a function of the time since sunrise normalized per local day-time duration. Panels B–E: number of jets for four different latitude ranges as a function of the time since sunrise. The vertical black lines represent the approximate sunset time computed for three different dates near perihelion passage. The high southern latitudes in panel B were always illuminated in this period, and in this case, the sunrise time was set to zero.
Current usage metrics show cumulative count of Article Views (full-text article views including HTML views, PDF and ePub downloads, according to the available data) and Abstracts Views on Vision4Press platform.
Data correspond to usage on the plateform after 2015. The current usage metrics is available 48-96 hours after online publication and is updated daily on week days.
Initial download of the metrics may take a while.