Fig. 14
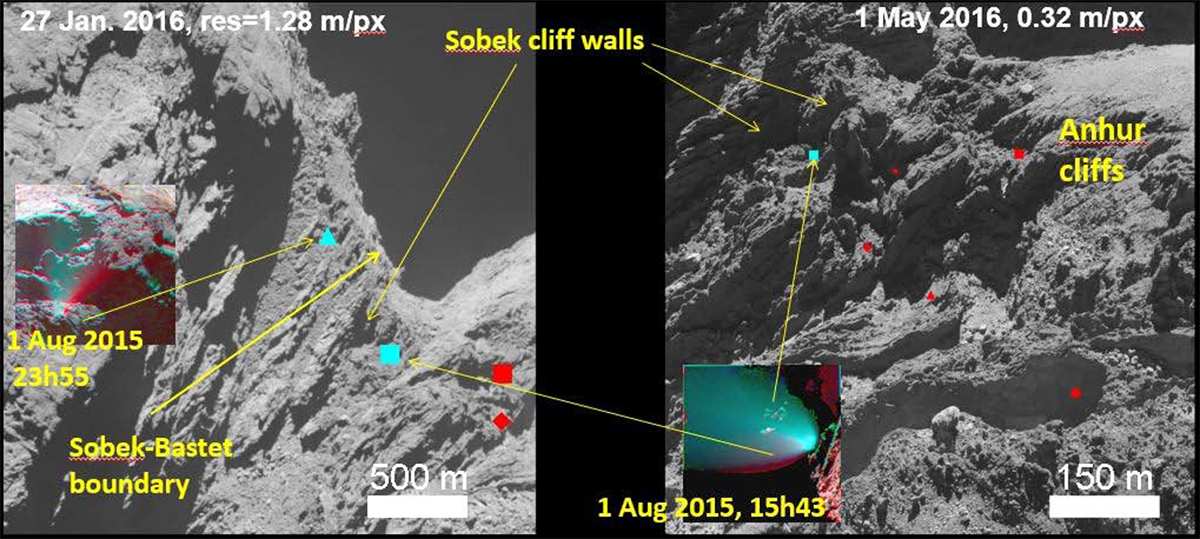
Sobek region seen on 27 January 2016 at 18h20 with a spatial resolution of 1.28 m px−1 (on the left), and on 1 May 2016, 18h11, with a resolution of 0.32 m px−1 (on the right). The cyan square and triangle represent the two Sobek outburst locations as identified on 1 August 2015 at 15h43 and 23h55, respectively (jets 177 and 178 in Table A.1), while the red symbols denote some jets that departed from the nearby Anhur region (see Fig. 11).
Current usage metrics show cumulative count of Article Views (full-text article views including HTML views, PDF and ePub downloads, according to the available data) and Abstracts Views on Vision4Press platform.
Data correspond to usage on the plateform after 2015. The current usage metrics is available 48-96 hours after online publication and is updated daily on week days.
Initial download of the metrics may take a while.