Fig. 11
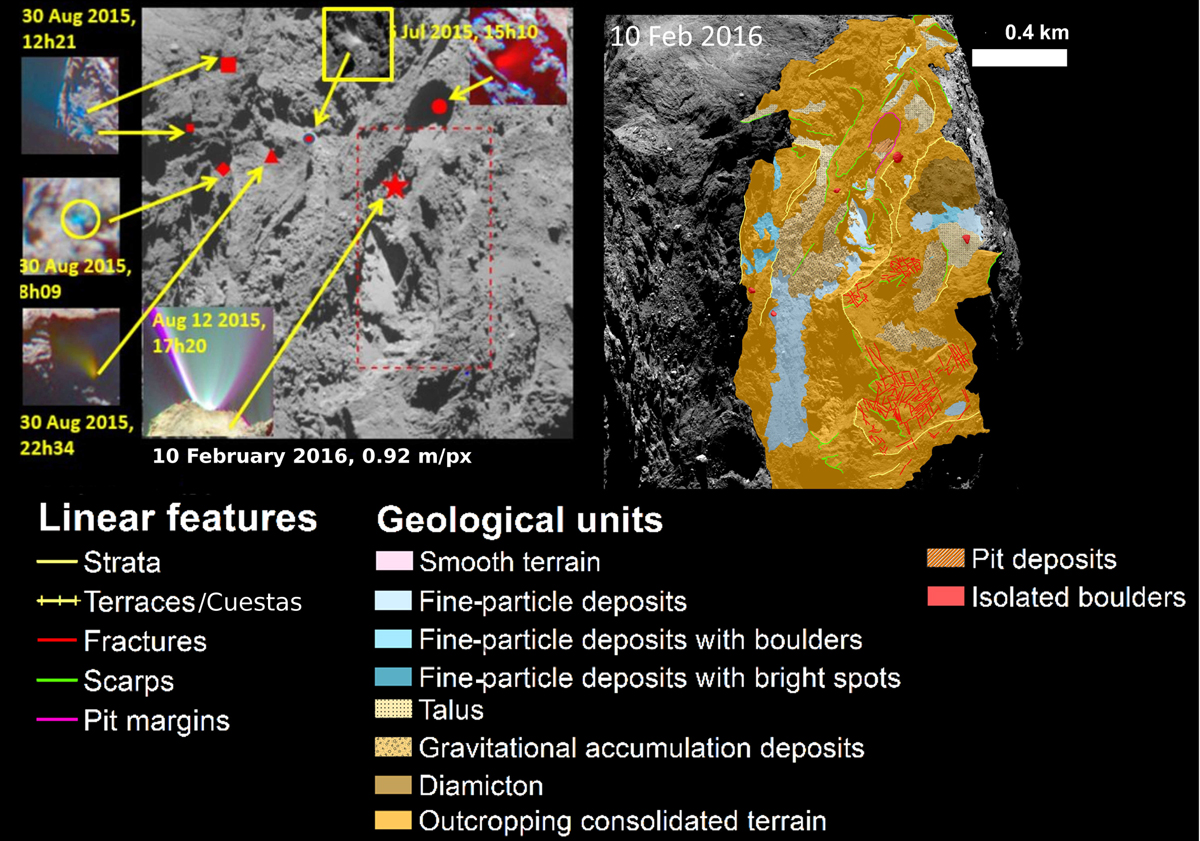
Left panel: Anhur region as seen on 10 February 2016, UT 7h14. The locations of the jets identified close to perihelion passage are superimposed. Resolution: 92 cm px−1. The symbols represent the corresponding positions of several jets: the star indicates the perihelion outburst, and the box indicates the uncertainties in the position of the jet sources; the circle shows a transient event on 26 July 2015, 15h10 (jet 4 in Table A.1); squares show the double type-C outbursts on 30 August 2015 at 12h21 (jets 17 and 18 in Table A.1), and the large square corresponds to the brighter of the two jets (jet 18); and the diamond indicates a transient event on 30 August 2015 at 8h09 (jet 13 in Table A.1). Right panel: geomorphological maps of the Anhur region from Fornasier et al. (2017).
Current usage metrics show cumulative count of Article Views (full-text article views including HTML views, PDF and ePub downloads, according to the available data) and Abstracts Views on Vision4Press platform.
Data correspond to usage on the plateform after 2015. The current usage metrics is available 48-96 hours after online publication and is updated daily on week days.
Initial download of the metrics may take a while.