Fig. 1
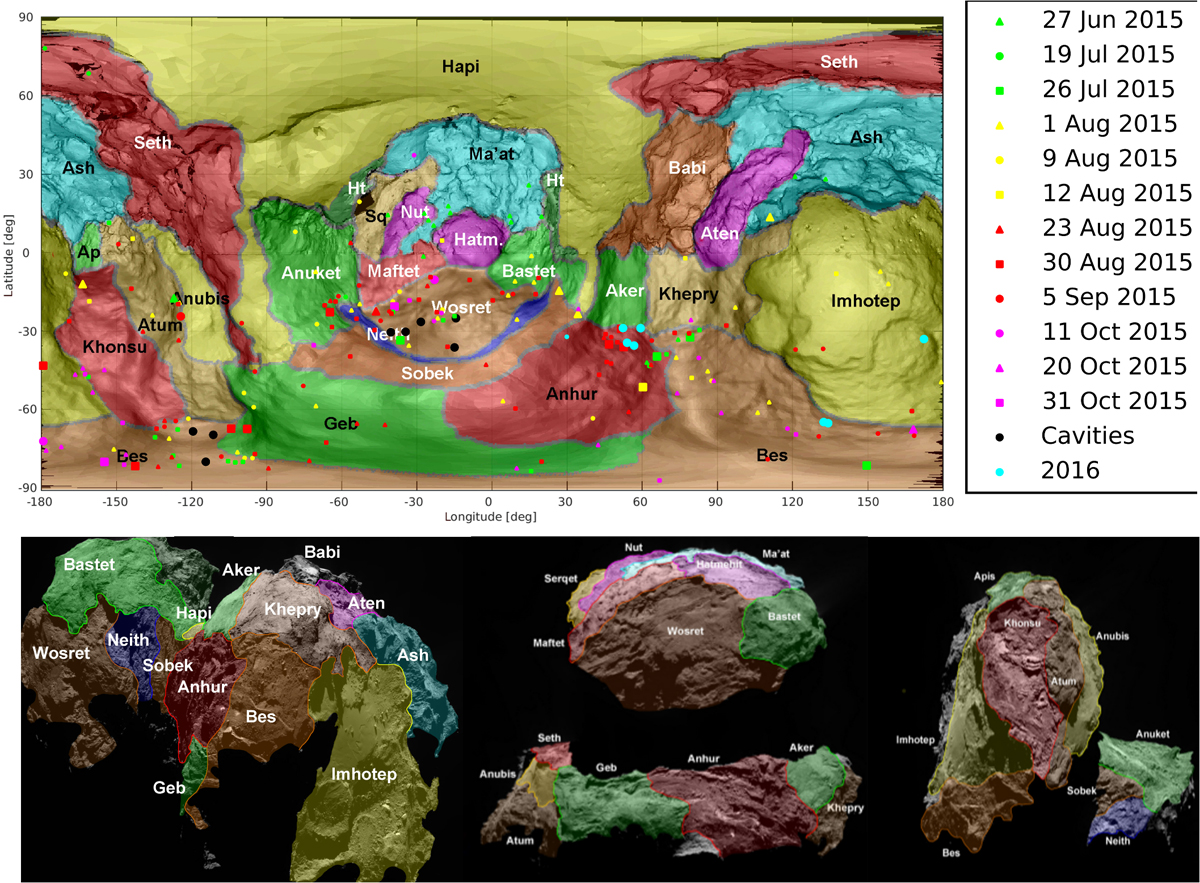
Top: map of the comet. We show superposed the jet sources that were identified during summer in the southern hemisphere of the comet. The locations of some nearby jets are averaged for clarity, and some notable jets are represented with larger symbols. Black circles represent cavities that were found to be active in different data sets (see Table A.1 for details). Cyan points represent events observed in 2016 that are reported here for the dust plume in the Bes region, are reported in Agarwal et al. (2017) for the outburst in the Imhotep region, and are reported in Fornasier et al. (2017) for the jets in the Anhur region. Bottom: three different views of the southern hemisphere of 67P. Regional boundaries are overlaid. The complete 3D views of the comet nucleus with all the regions superposed are shown in El-Maarry et al. (2015, 2016, 2017a).
Current usage metrics show cumulative count of Article Views (full-text article views including HTML views, PDF and ePub downloads, according to the available data) and Abstracts Views on Vision4Press platform.
Data correspond to usage on the plateform after 2015. The current usage metrics is available 48-96 hours after online publication and is updated daily on week days.
Initial download of the metrics may take a while.