Fig. 4
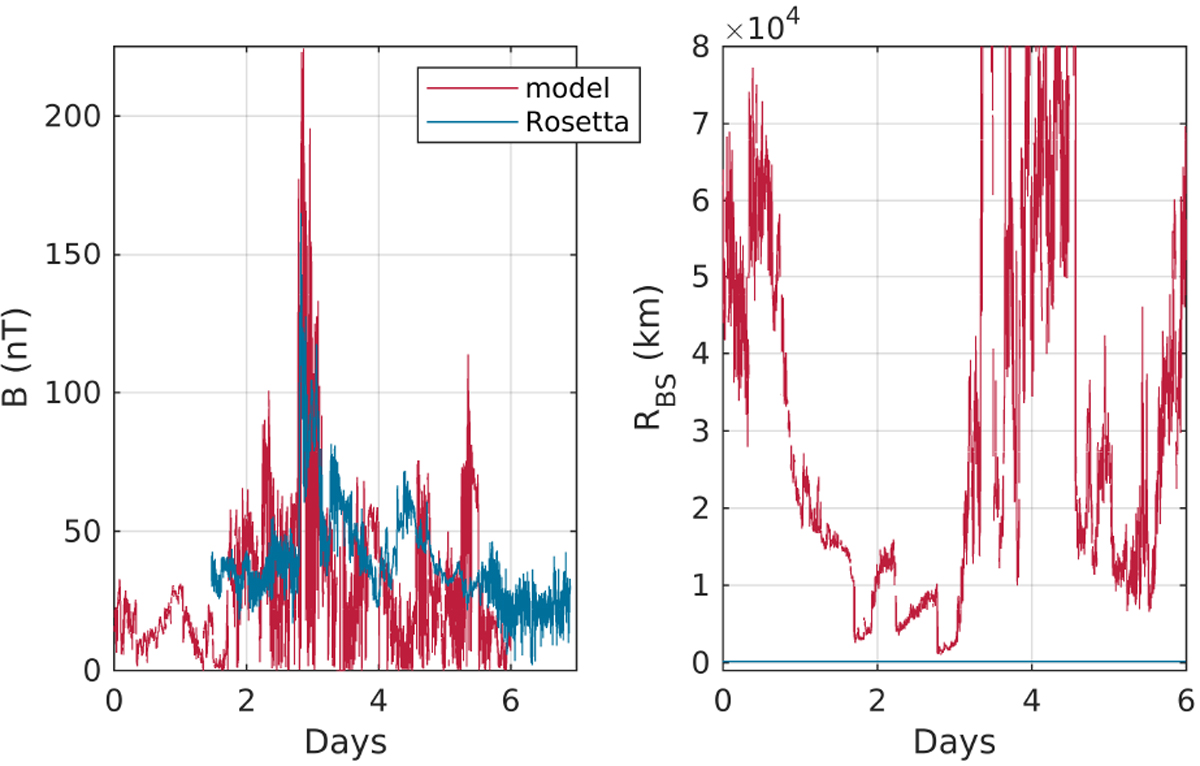
Modeled magnetic field, bow shock position (red), and measured field and spacecraft position (blue). The input conditions for both models were calculated from OMNI solar wind observations using a Parker model for the propagation to the comet, and a gas production rate of Q = 5.8 × 1027 s−1. Day 0 corresponds to OMNI data from June 21, 2015. For readability, the magnetic field observations have been averaged over four minutes.
Current usage metrics show cumulative count of Article Views (full-text article views including HTML views, PDF and ePub downloads, according to the available data) and Abstracts Views on Vision4Press platform.
Data correspond to usage on the plateform after 2015. The current usage metrics is available 48-96 hours after online publication and is updated daily on week days.
Initial download of the metrics may take a while.