Fig. 1
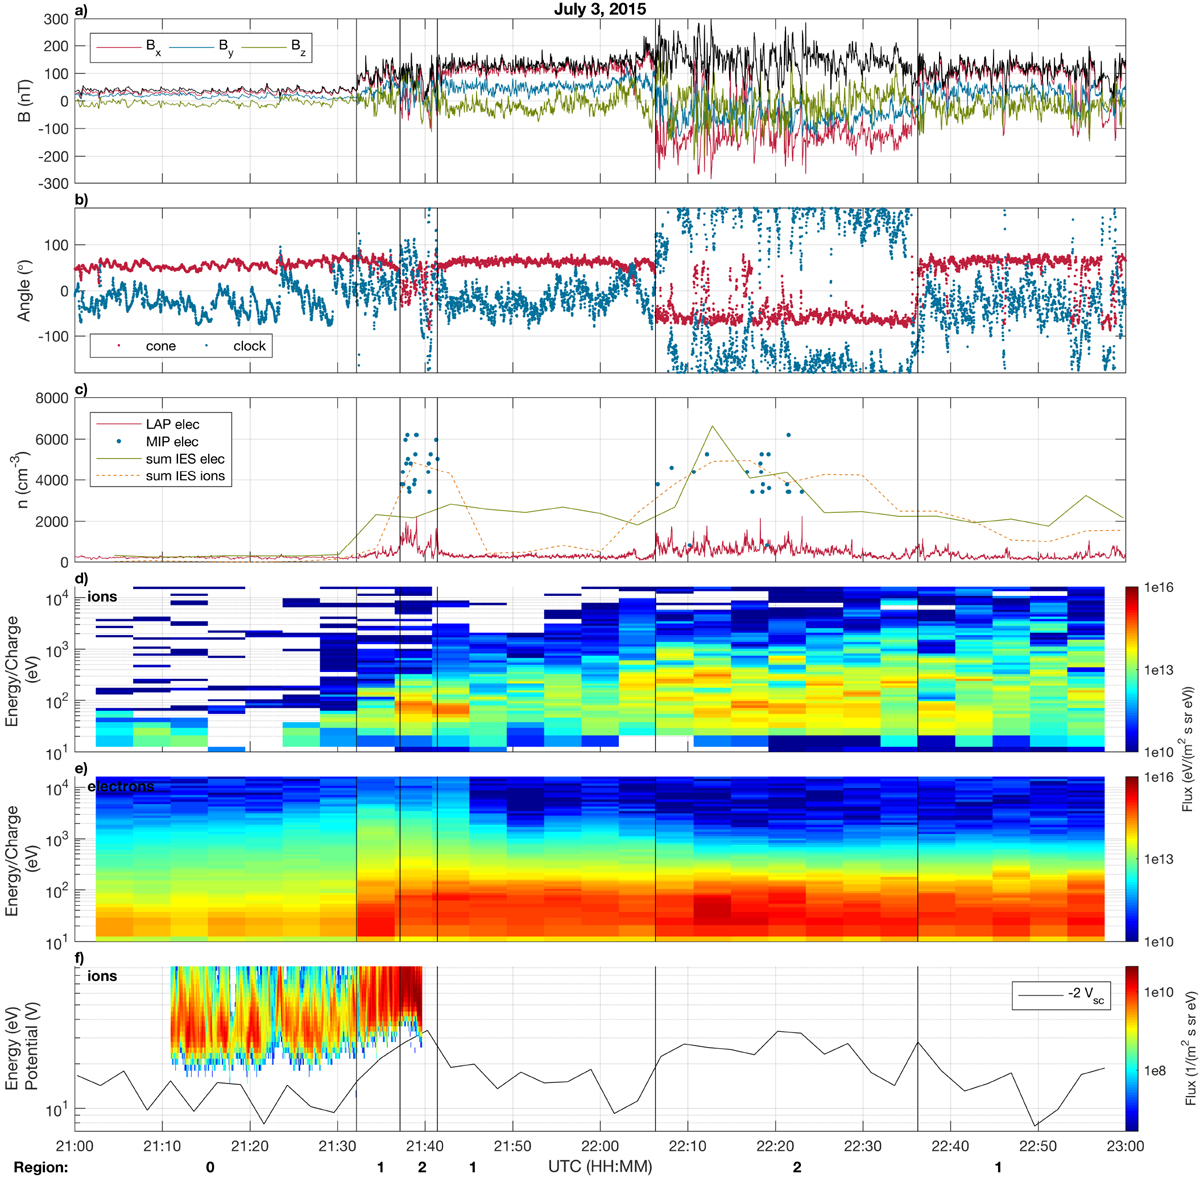
Plasma parameters as observed by RPC during the main event. Panel a: magnetic field components and magnitude (black). Panel b: cone and clock angle of the magnetic field. Panel c: estimates of the plasma density from different instruments. IES observations are energy-summed flux adjusted to fit the scale. Panels d and e: electron and ion flux integrated over the entire field of view of IES. Panel f: spacecraft potential (multiplied by − 2 for clarity) derived from LAP sweeps and ion energy spectrogram measured by ICA. The vertical lines indicate the boundaries of the three plasma regions (indicated by numbers at the bottom).
Current usage metrics show cumulative count of Article Views (full-text article views including HTML views, PDF and ePub downloads, according to the available data) and Abstracts Views on Vision4Press platform.
Data correspond to usage on the plateform after 2015. The current usage metrics is available 48-96 hours after online publication and is updated daily on week days.
Initial download of the metrics may take a while.