Free Access
Fig. 7
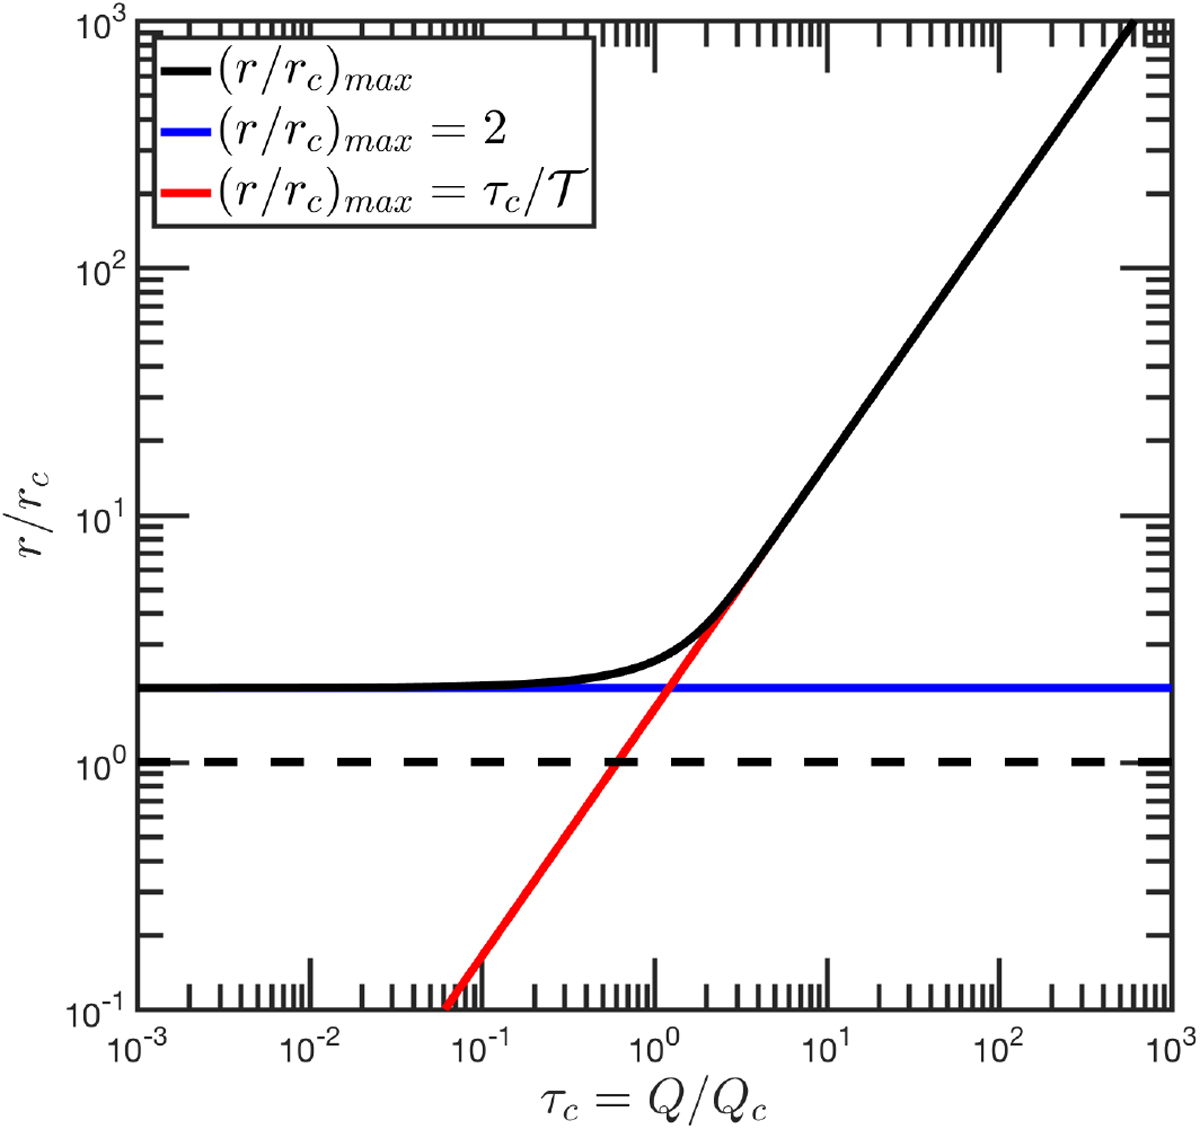
Cometocentric distance normalized to rc at the surface of the maximum ion number density (black solid line) as a function of the optical depth τc at the surface. Two asymptotic profiles are plotted in blue (τc ≪ 1) and red (τc ≫ 1). The dashed line corresponds to the surface of the comet.
Current usage metrics show cumulative count of Article Views (full-text article views including HTML views, PDF and ePub downloads, according to the available data) and Abstracts Views on Vision4Press platform.
Data correspond to usage on the plateform after 2015. The current usage metrics is available 48-96 hours after online publication and is updated daily on week days.
Initial download of the metrics may take a while.