Fig. 6
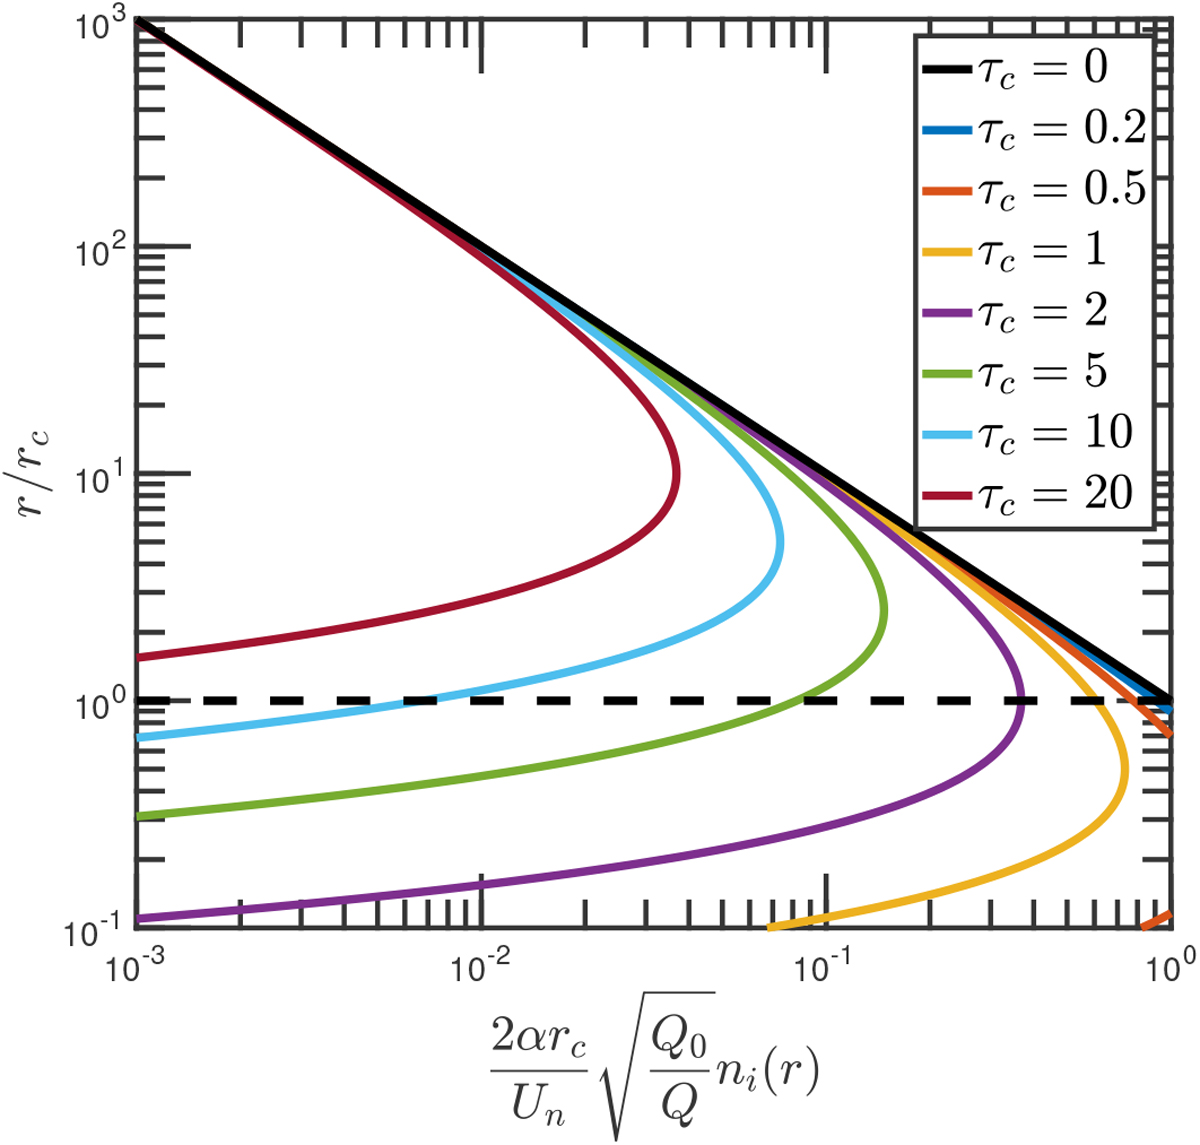
Ion number density profile as a function of the cometary distance (normalized to the cometocentric distance at the surface, rc) for the equilibrium between the attenuated solar flux through the coma (referred to here as different values of the optical depth at the cometary surface) and the e− -ion dissociative recombination rate (see Eq. (19)). The solid black line corresponds to the density profile without photoabsorption and the dashed line to the cometary surface. Increasing τc is similar to increasing the outgassing rate. These profiles depend on neither Un nor α as they have been scaled accordingly.
Current usage metrics show cumulative count of Article Views (full-text article views including HTML views, PDF and ePub downloads, according to the available data) and Abstracts Views on Vision4Press platform.
Data correspond to usage on the plateform after 2015. The current usage metrics is available 48-96 hours after online publication and is updated daily on week days.
Initial download of the metrics may take a while.