Fig. 5
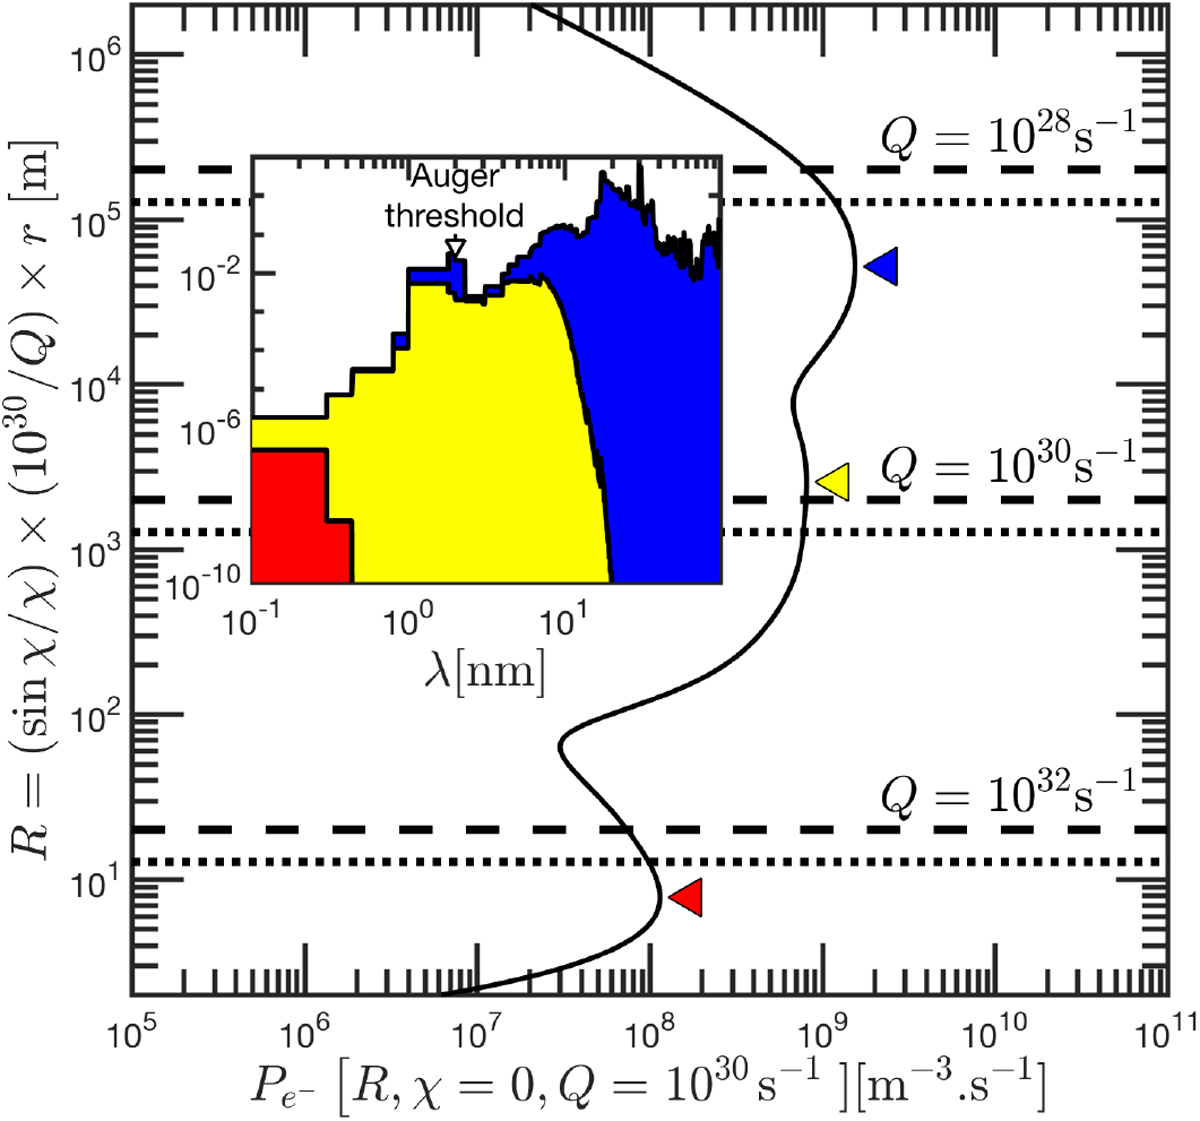
Photoelectron production rate as a function of the scaled cometocentric distance R (see text) for a pure water coma. The solar flux is taken from TIMED/SEE on 2015 August 15 at 1 au, with an outgassing rate of Q = 1030 s−1 and at a solar zenith angle of χ = 0. The expanding velocity is set to Un = 600 m⋅s−1. The shape of the production rate remains unchanged for ∀r, Q and χ, although the radial dependency (ordinate) and the amplitude (abscissa) have to be adjusted accordingly (see the relations given by Eqs. (15) and (16)). The location of the surface of 67P (rc = 2 km) has been placed at the corresponding parameter R for different outgassing rates (shown with dashed and dotted horizontal lines for χ = 0 and χ = π∕2, respectively). For each local maximum in photoionization (identified by colored triangles), we plot the corresponding attenuated solar spectral flux at that location in the same color (see inset): the primary peak is driven by the 15–40 nm spectral flux (blue), the secondary peak by the 1–10 nm spectral flux (yellow), and the tertiary peak by the <0.5 nm spectral flux(red). The abscissa in the inset is in log-scale to visualize short wavelengths.
Current usage metrics show cumulative count of Article Views (full-text article views including HTML views, PDF and ePub downloads, according to the available data) and Abstracts Views on Vision4Press platform.
Data correspond to usage on the plateform after 2015. The current usage metrics is available 48-96 hours after online publication and is updated daily on week days.
Initial download of the metrics may take a while.