Fig. 4
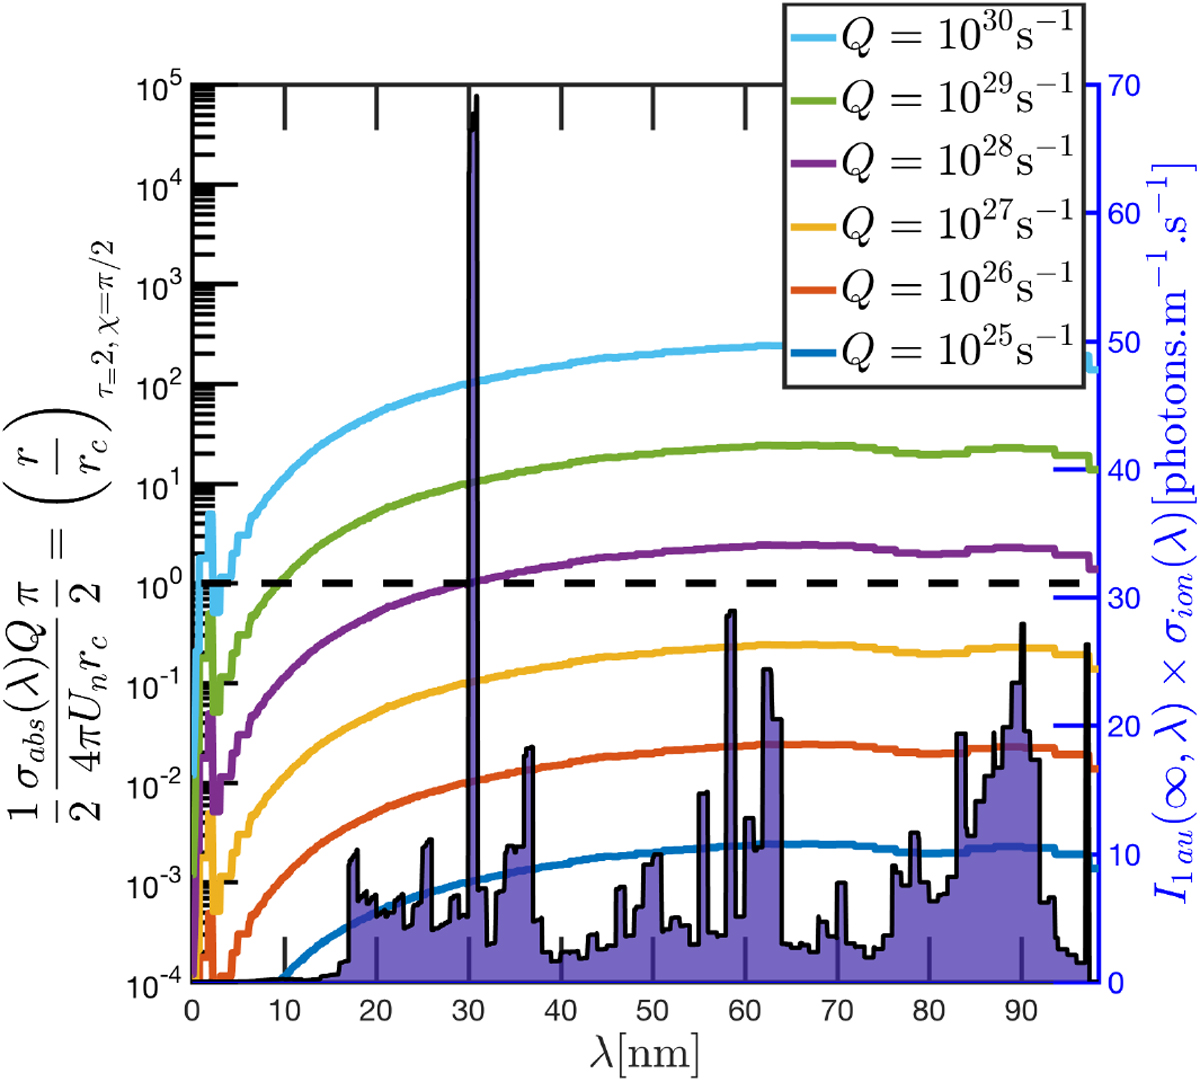
Cometocentric distance normalized to rc at which the optical depth τλ[r, χ = π∕2] = 2 for different outgassing rates Q. The dashed line defines the position of the surface. We also plot as a function of λ the product between the solar photon spectral flux I1 au (2015 Aug 15 at 1 au) and the total photoionization cross section σion (black line). The spectral range displayed extends up to 98.2 nm, which is the ionization threshold wavelength of water. The expanding velocity is set to Un = 600 m⋅s−1.
Current usage metrics show cumulative count of Article Views (full-text article views including HTML views, PDF and ePub downloads, according to the available data) and Abstracts Views on Vision4Press platform.
Data correspond to usage on the plateform after 2015. The current usage metrics is available 48-96 hours after online publication and is updated daily on week days.
Initial download of the metrics may take a while.