Fig. 3
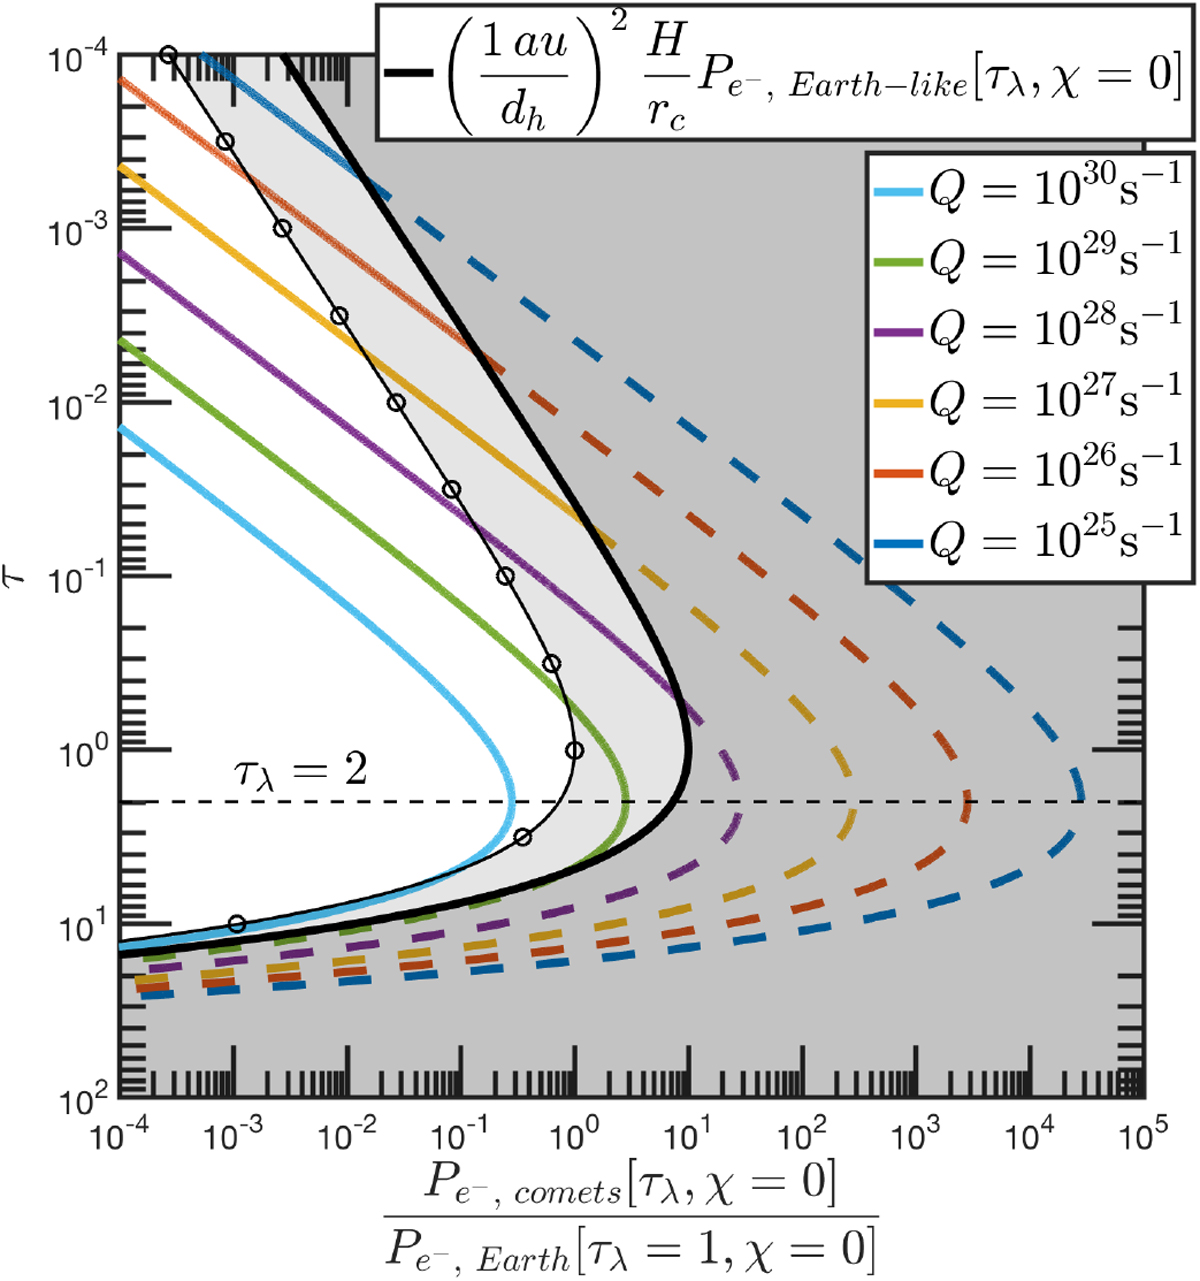
Photoelectron production rate as a function of the optical depth for different outgassing rates Q at 1 au. For comparison, we have overplotted the profile for an isothermal atmosphere in hydrostatic equilibrium (solid line with circles) with an Earth-like scale height of ~ 20 km made of water vapor (see text). We scaled all profiles with respect to the maximum of the hydrostatic case. The solid black line corresponds to the photoelectron production rate at the surface for any outgassing rate (see Eq. (11)) for a given heliocentric distance (here dh = 1 au). Colored lines are the electron production rates for different outgassing rates: above the surface (solid), and below the surface (dashed). The light gray area corresponds to the region where the photoelectron production rate is higher at comets than for the hydrostatic case. The dark gray region represents values for which the corresponding cometocentric distance would be below the surface. The expanding velocity is set to Un = 600 m⋅s−1.
Current usage metrics show cumulative count of Article Views (full-text article views including HTML views, PDF and ePub downloads, according to the available data) and Abstracts Views on Vision4Press platform.
Data correspond to usage on the plateform after 2015. The current usage metrics is available 48-96 hours after online publication and is updated daily on week days.
Initial download of the metrics may take a while.