Fig. 12
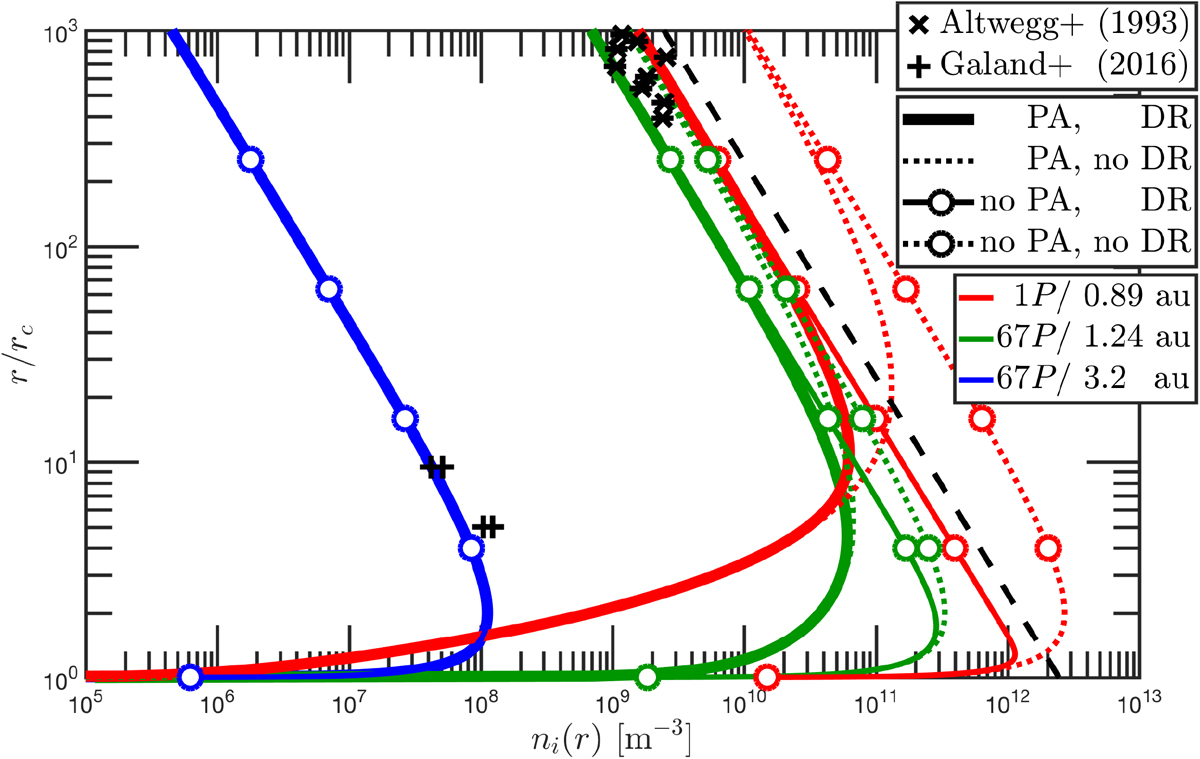
Comparison of the plasma number density profiles with respect to the scaled cometocentric distances between 1P (red, 0.89 au) and 67P (blue, 3.2 au, and green, 1.24 au). The profiles have been generated under different assumptions: including PA and DR (thick solid lines), without PA (circles), and without DR (dotted lines). The dashed line corresponds to the plasma density profile from Cravens (1987) with Te = 1000 K. The black crosses with the error bars are the in situ plasma density measurement by the ion mass spectrometer onboard theGiotto spacecraft at 1P/Halley during the Giotto flyby (Altwegg et al. 1993). The black pluses are in situ plasma density observations by RPC-MIP on board Rosetta at 3.2 au (Galand et al. 2016).
Current usage metrics show cumulative count of Article Views (full-text article views including HTML views, PDF and ePub downloads, according to the available data) and Abstracts Views on Vision4Press platform.
Data correspond to usage on the plateform after 2015. The current usage metrics is available 48-96 hours after online publication and is updated daily on week days.
Initial download of the metrics may take a while.