Fig. 1
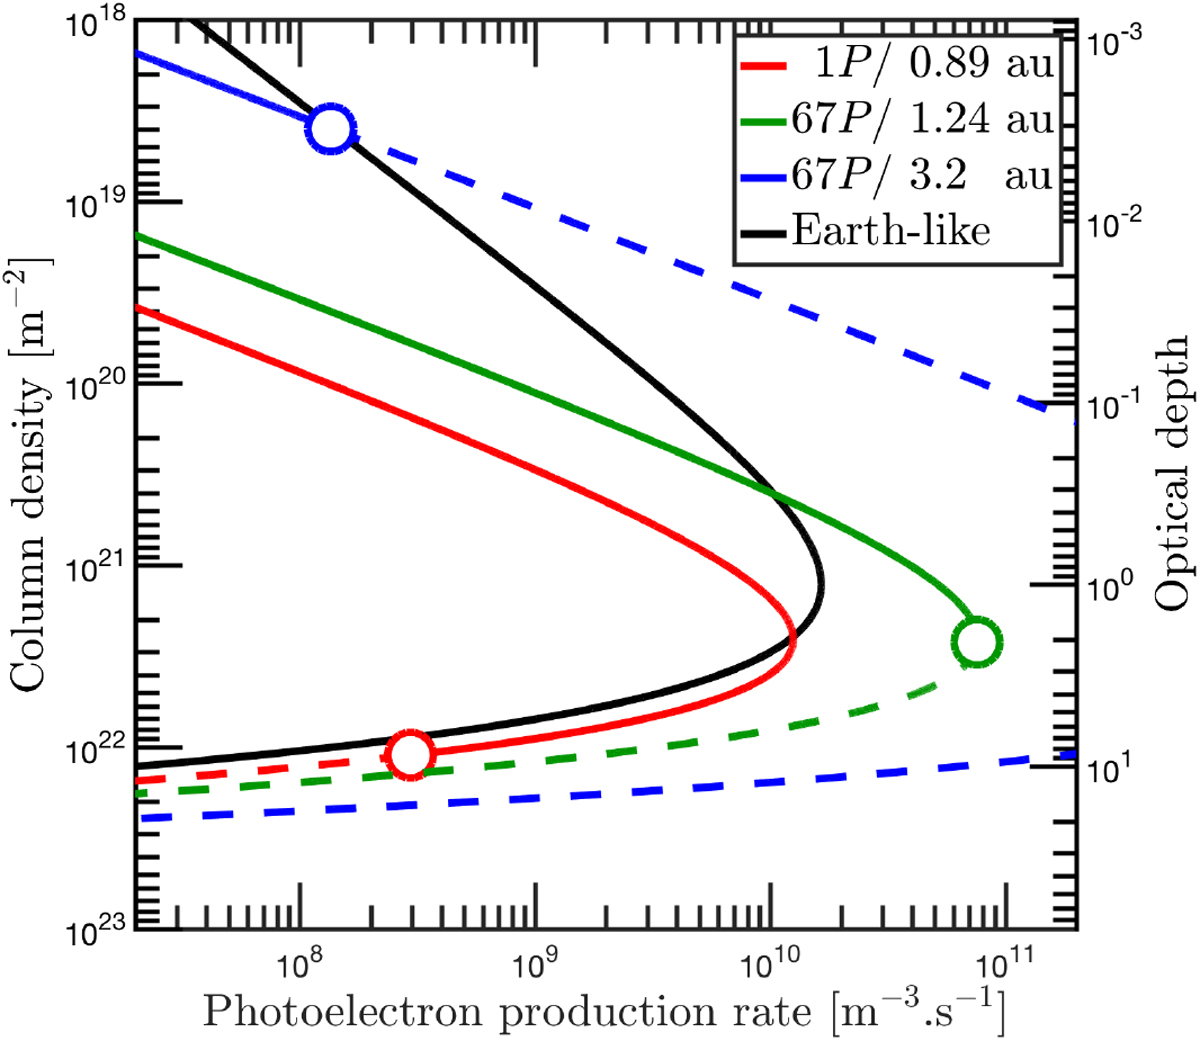
Photoelectron production rate at the solar zenith angle 0° as a functionof column density (left y-axis) or optical depth (right y-axis). Two cases are represented: (1) expanding comae: 1P during the Giotto flyby (red solid line) and 67P at two different heliocentric distances (green and blue solid lines, see legend and Table 2), (2) atmospheres in hydrostatic equilibrium like Earth at 1 au (black, solid line). The number density scale height H for the hydrostatic equilibrium case is set to 20 km, and the same photoabsorption cross section is assumed for all three cases. The dotted line corresponds to the production rate below the cometary surface. The circles identify the nucleus surface, and the dotted line corresponds to the hypothetical production rate below.
Current usage metrics show cumulative count of Article Views (full-text article views including HTML views, PDF and ePub downloads, according to the available data) and Abstracts Views on Vision4Press platform.
Data correspond to usage on the plateform after 2015. The current usage metrics is available 48-96 hours after online publication and is updated daily on week days.
Initial download of the metrics may take a while.