Fig. 4
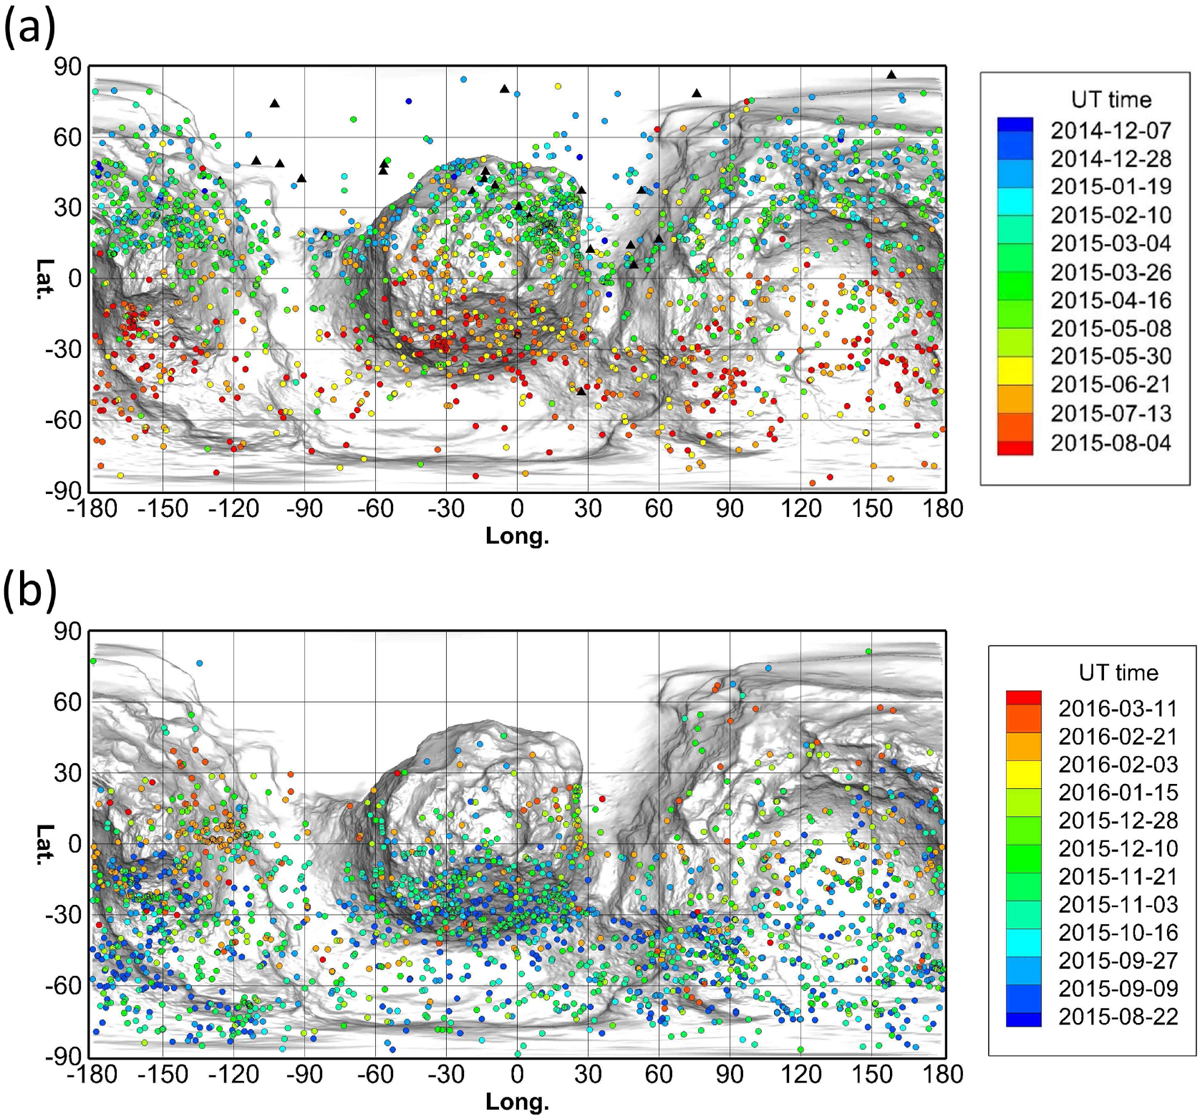
Time variation in locations of the jet source regions (or footpoints) from month to month during the Rosetta close-up observationsin the (a) pre-perihelion period and (b) post-perihelion period. The black triangles show the additional jet sources between August and September 2014 from Lin et al. (2015). The dots represent the footpoint positions of the jet, with an error circle radius of about 200 m for most cases.
Current usage metrics show cumulative count of Article Views (full-text article views including HTML views, PDF and ePub downloads, according to the available data) and Abstracts Views on Vision4Press platform.
Data correspond to usage on the plateform after 2015. The current usage metrics is available 48-96 hours after online publication and is updated daily on week days.
Initial download of the metrics may take a while.